Chart Themes Example
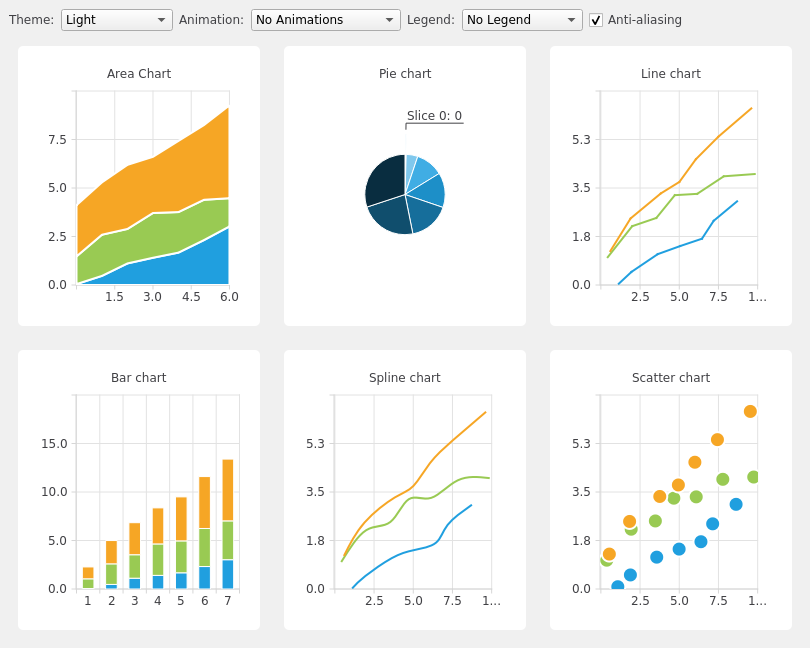
The example shows the look and feel of the different built-in themes.
This example shows the look and feel of the different built-in themes for some of the supported chart types.
# Copyright (C) 2022 The Qt Company Ltd.
# SPDX-License-Identifier: LicenseRef-Qt-Commercial OR BSD-3-Clause
from __future__ import annotations

"""PySide6 port of the Chart Themes example from Qt v5.x"""

import sys
from PySide6.QtCore import QPointF, Qt
from PySide6.QtGui import QColor, QPainter, QPalette
from PySide6.QtWidgets import (QApplication, QMainWindow, QSizePolicy,
                               QWidget)
from PySide6.QtCharts import (QAreaSeries, QBarSet, QChart, QChartView,
                              QLineSeries, QPieSeries, QScatterSeries,
                              QSplineSeries, QStackedBarSeries)

from ui_themewidget import Ui_ThemeWidgetForm as ui

from random import random, uniform


class ThemeWidget(QWidget):
    def __init__(self, parent):
        QWidget.__init__(self, parent)
        self.charts = []

        self.ui = ui()
        self.list_count = 3
        self.value_max = 10
        self.value_count = 7
        self.data_table = self.generate_random_data(self.list_count,
                                                    self.value_max, self.value_count)

        self.ui.setupUi(self)
        self.populate_themebox()
        self.populate_animationbox()
        self.populate_legendbox()

        # Area Chart
        chart_view = QChartView(self.create_areachart())
        self.ui.gridLayout.addWidget(chart_view, 1, 0)
        self.charts.append(chart_view)

        # Pie Chart
        chart_view = QChartView(self.create_pie_chart())
        chart_view.setSizePolicy(QSizePolicy.Ignored, QSizePolicy.Ignored)
        self.ui.gridLayout.addWidget(chart_view, 1, 1)
        self.charts.append(chart_view)

        # Line Chart
        chart_view = QChartView(self.create_line_chart())
        self.ui.gridLayout.addWidget(chart_view, 1, 2)
        self.charts.append(chart_view)

        # Bar Chart
        chart_view = QChartView(self.create_bar_chart())
        self.ui.gridLayout.addWidget(chart_view, 2, 0)
        self.charts.append(chart_view)

        # Spline Chart
        chart_view = QChartView(self.create_spline_chart())
        self.ui.gridLayout.addWidget(chart_view, 2, 1)
        self.charts.append(chart_view)

        # Scatter Chart
        chart_view = QChartView(self.create_scatterchart())
        self.ui.gridLayout.addWidget(chart_view, 2, 2)
        self.charts.append(chart_view)

        # Set defaults
        self.ui.antialiasCheckBox.setChecked(True)

        # Set the colors from the light theme as default ones
        pal = qApp.palette()  # noqa: F821
        pal.setColor(QPalette.Window, QColor(0xf0f0f0))
        pal.setColor(QPalette.WindowText, QColor(0x404044))
        qApp.setPalette(pal)  # noqa: F821

        self.update_ui()

    def generate_random_data(self, list_count, value_max, value_count):
        data_table = []
        for i in range(list_count):
            data_list = []
            y_value = 0
            for j in range(value_count):
                constant = value_max / float(value_count)
                y_value += uniform(0, constant)
                x_value = (j + random()) * constant
                value = QPointF(x_value, y_value)
                label = f"Slice {i}: {j}"
                data_list.append((value, label))
            data_table.append(data_list)

        return data_table

    def populate_themebox(self):
        theme = self.ui.themeComboBox

        theme.addItem("Light", QChart.ChartThemeLight)
        theme.addItem("Blue Cerulean", QChart.ChartThemeBlueCerulean)
        theme.addItem("Dark", QChart.ChartThemeDark)
        theme.addItem("Brown Sand", QChart.ChartThemeBrownSand)
        theme.addItem("Blue NCS", QChart.ChartThemeBlueNcs)
        theme.addItem("High Contrast", QChart.ChartThemeHighContrast)
        theme.addItem("Blue Icy", QChart.ChartThemeBlueIcy)
        theme.addItem("Qt", QChart.ChartThemeQt)

    def populate_animationbox(self):
        animated = self.ui.animatedComboBox

        animated.addItem("No Animations", QChart.NoAnimation)
        animated.addItem("GridAxis Animations", QChart.GridAxisAnimations)
        animated.addItem("Series Animations", QChart.SeriesAnimations)
        animated.addItem("All Animations", QChart.AllAnimations)

    def populate_legendbox(self):
        legend = self.ui.legendComboBox

        legend.addItem("No Legend ", 0)
        legend.addItem("Legend Top", Qt.AlignTop)
        legend.addItem("Legend Bottom", Qt.AlignBottom)
        legend.addItem("Legend Left", Qt.AlignLeft)
        legend.addItem("Legend Right", Qt.AlignRight)

    def create_areachart(self):
        chart = QChart()
        chart.setTitle("Area Chart")

        # The lower series initialized to zero values
        lower_series = None
        name = "Series "
        for i in range(len(self.data_table)):
            upper_series = QLineSeries(chart)
            for j in range(len(self.data_table[i])):
                data = self.data_table[i][j]
                if lower_series:
                    points = lower_series.points()
                    y_value = points[i].y() + data[0].y()
                    upper_series.append(QPointF(j, y_value))
                else:
                    upper_series.append(QPointF(j, data[0].y()))
            area = QAreaSeries(upper_series, lower_series)
            area.setName(f"{name}{i}")
            chart.addSeries(area)
            lower_series = upper_series

        chart.createDefaultAxes()
        axis_x = chart.axes(Qt.Orientation.Horizontal)[0]
        axis_x.setRange(0, self.value_count - 1)
        axis_y = chart.axes(Qt.Vertical)[0]
        axis_y.setRange(0, self.value_max)
        # Add space to label to add space between labels and axis
        axis_y.setLabelFormat("%.1f  ")

        return chart

    def create_bar_chart(self):
        chart = QChart()
        chart.setTitle("Bar chart")

        series = QStackedBarSeries(chart)
        for i in range(len(self.data_table)):
            barset = QBarSet(f"Bar set {i}")
            for data in self.data_table[i]:
                barset.append(data[0].y())
            series.append(barset)

        chart.addSeries(series)

        chart.createDefaultAxes()
        axis_y = chart.axes(Qt.Vertical)[0]
        axis_y.setRange(0, self.value_max * 2)
        # Add space to label to add space between labels and axis
        axis_y.setLabelFormat("%.1f  ")

        return chart

    def create_line_chart(self):
        chart = QChart()
        chart.setTitle("Line chart")

        name = "Series "
        for i, lst in enumerate(self.data_table):
            series = QLineSeries(chart)
            for data in lst:
                series.append(data[0])
            series.setName(f"{name}{i}")
            chart.addSeries(series)

        chart.createDefaultAxes()
        axis_x = chart.axes(Qt.Orientation.Horizontal)[0]
        axis_x.setRange(0, self.value_max)
        axis_y = chart.axes(Qt.Vertical)[0]
        axis_y.setRange(0, self.value_count)
        # Add space to label to add space between labels and axis
        axis_y.setLabelFormat("%.1f  ")

        return chart

    def create_pie_chart(self):
        chart = QChart()
        chart.setTitle("Pie chart")

        series = QPieSeries(chart)
        for data in self.data_table[0]:
            slc = series.append(data[1], data[0].y())
            if data == self.data_table[0][0]:
                # Show the first slice exploded with label
                slc.setLabelVisible()
                slc.setExploded()
                slc.setExplodeDistanceFactor(0.5)

        series.setPieSize(0.4)
        chart.addSeries(series)

        return chart

    def create_spline_chart(self):
        chart = QChart()
        chart.setTitle("Spline chart")
        name = "Series "
        for i, lst in enumerate(self.data_table):
            series = QSplineSeries(chart)
            for data in lst:
                series.append(data[0])
            series.setName(f"{name}{i}")
            chart.addSeries(series)

        chart.createDefaultAxes()
        axis_x = chart.axes(Qt.Orientation.Horizontal)[0]
        axis_x.setRange(0, self.value_max)
        axis_y = chart.axes(Qt.Vertical)[0]
        axis_y.setRange(0, self.value_count)
        # Add space to label to add space between labels and axis
        axis_y.setLabelFormat("%.1f  ")

        return chart

    def create_scatterchart(self):
        chart = QChart()
        chart.setTitle("Scatter chart")
        name = "Series "
        for i, lst in enumerate(self.data_table):
            series = QScatterSeries(chart)
            for data in lst:
                series.append(data[0])
            series.setName(f"{name}{i}")
            chart.addSeries(series)

        chart.createDefaultAxes()
        axis_x = chart.axes(Qt.Orientation.Horizontal)[0]
        axis_x.setRange(0, self.value_max)
        axis_y = chart.axes(Qt.Vertical)[0]
        axis_y.setRange(0, self.value_count)
        # Add space to label to add space between labels and axis
        axis_y.setLabelFormat("%.1f  ")

        return chart

    def update_ui(self):
        def set_colors(window_color, text_color):
            pal = self.window().palette()
            pal.setColor(QPalette.Window, window_color)
            pal.setColor(QPalette.WindowText, text_color)
            self.window().setPalette(pal)

        idx = self.ui.themeComboBox.currentIndex()
        theme = self.ui.themeComboBox.itemData(idx)

        if len(self.charts):
            chart_theme = self.charts[0].chart().theme()
            if chart_theme != theme:
                for chart_view in self.charts:
                    chart_view.chart().setTheme(theme)

                # Set palette colors based on selected theme
                if theme == QChart.ChartThemeLight:
                    set_colors(QColor(0xf0f0f0), QColor(0x404044))
                elif theme == QChart.ChartThemeDark:
                    set_colors(QColor(0x121218), QColor(0xd6d6d6))
                elif theme == QChart.ChartThemeBlueCerulean:
                    set_colors(QColor(0x40434a), QColor(0xd6d6d6))
                elif theme == QChart.ChartThemeBrownSand:
                    set_colors(QColor(0x9e8965), QColor(0x404044))
                elif theme == QChart.ChartThemeBlueNcs:
                    set_colors(QColor(0x018bba), QColor(0x404044))
                elif theme == QChart.ChartThemeHighContrast:
                    set_colors(QColor(0xffab03), QColor(0x181818))
                elif theme == QChart.ChartThemeBlueIcy:
                    set_colors(QColor(0xcee7f0), QColor(0x404044))
                else:
                    set_colors(QColor(0xf0f0f0), QColor(0x404044))

        # Update antialiasing
        checked = self.ui.antialiasCheckBox.isChecked()
        for chart in self.charts:
            chart.setRenderHint(QPainter.RenderHint.Antialiasing, checked)

        # Update animation options
        idx = self.ui.animatedComboBox.currentIndex()
        options = self.ui.animatedComboBox.itemData(idx)

        if len(self.charts):
            animation_options = self.charts[0].chart().animationOptions()
            if animation_options != options:
                for chart_view in self.charts:
                    chart_view.chart().setAnimationOptions(options)

        # Update legend alignment
        idx = self.ui.legendComboBox.currentIndex()
        alignment = self.ui.legendComboBox.itemData(idx)

        if not alignment:
            for chart_view in self.charts:
                chart_view.chart().legend().hide()
        else:
            for chart_view in self.charts:
                alignment_name = Qt.AlignTop
                if alignment == 32:
                    alignment_name = Qt.AlignTop
                elif alignment == 64:
                    alignment_name = Qt.AlignBottom
                elif alignment == 1:
                    alignment_name = Qt.AlignLeft
                elif alignment == 2:
                    alignment_name = Qt.AlignRight
                chart_view.chart().legend().setAlignment(alignment_name)
                chart_view.chart().legend().show()


if __name__ == "__main__":
    app = QApplication(sys.argv)
    window = QMainWindow()
    widget = ThemeWidget(None)
    window.setCentralWidget(widget)
    available_geometry = window.screen().availableGeometry()
    size = available_geometry.height() * 0.75
    window.setFixedSize(size, size * 0.8)
    window.show()
    sys.exit(app.exec())
# Chart themes

To generated the file `ui_themewidget.py`, the following
command need to be executed:

`pyside6-uic themewidget.ui -o ui_themewidget.py`

Also, if you modify the UI file, then you would need
to run the previous command again.
<?xml version="1.0" encoding="UTF-8"?>
<ui version="4.0">
 <class>ThemeWidgetForm</class>
 <widget class="QWidget" name="ThemeWidgetForm">
  <property name="geometry">
   <rect>
    <x>0</x>
    <y>0</y>
    <width>900</width>
    <height>600</height>
   </rect>
  </property>
  <layout class="QGridLayout" name="gridLayout">
   <item row="0" column="0" colspan="3">
    <layout class="QHBoxLayout" name="horizontalLayout">
     <item>
      <widget class="QLabel" name="themeLabel">
       <property name="text">
        <string>Theme:</string>
       </property>
      </widget>
     </item>
     <item>
      <widget class="QComboBox" name="themeComboBox"/>
     </item>
     <item>
      <widget class="QLabel" name="animatedLabel">
       <property name="text">
        <string>Animation:</string>
       </property>
      </widget>
     </item>
     <item>
      <widget class="QComboBox" name="animatedComboBox"/>
     </item>
     <item>
      <widget class="QLabel" name="legendLabel">
       <property name="text">
        <string>Legend:</string>
       </property>
      </widget>
     </item>
     <item>
      <widget class="QComboBox" name="legendComboBox"/>
     </item>
     <item>
      <widget class="QCheckBox" name="antialiasCheckBox">
       <property name="text">
        <string>Anti-aliasing</string>
       </property>
       <property name="checked">
        <bool>false</bool>
       </property>
      </widget>
     </item>
     <item>
      <spacer name="horizontalSpacer">
       <property name="orientation">
        <enum>Qt::Orientation::Horizontal</enum>
       </property>
       <property name="sizeHint" stdset="0">
        <size>
         <width>40</width>
         <height>20</height>
        </size>
       </property>
      </spacer>
     </item>
    </layout>
   </item>
  </layout>
 </widget>
 <resources/>
 <connections>
  <connection>
   <sender>themeComboBox</sender>
   <signal>currentIndexChanged(int)</signal>
   <receiver>ThemeWidgetForm</receiver>
   <slot>update_ui()</slot>
   <hints>
    <hint type="sourcelabel">
     <x>20</x>
     <y>20</y>
    </hint>
    <hint type="destinationlabel">
     <x>20</x>
     <y>20</y>
    </hint>
   </hints>
  </connection>
  <connection>
   <sender>antialiasCheckBox</sender>
   <signal>toggled(bool)</signal>
   <receiver>ThemeWidgetForm</receiver>
   <slot>update_ui()</slot>
   <hints>
    <hint type="sourcelabel">
     <x>20</x>
     <y>20</y>
    </hint>
    <hint type="destinationlabel">
     <x>20</x>
     <y>20</y>
    </hint>
   </hints>
  </connection>
  <connection>
   <sender>legendComboBox</sender>
   <signal>currentIndexChanged(int)</signal>
   <receiver>ThemeWidgetForm</receiver>
   <slot>update_ui()</slot>
   <hints>
    <hint type="sourcelabel">
     <x>20</x>
     <y>20</y>
    </hint>
    <hint type="destinationlabel">
     <x>20</x>
     <y>20</y>
    </hint>
   </hints>
  </connection>
  <connection>
   <sender>animatedComboBox</sender>
   <signal>currentIndexChanged(int)</signal>
   <receiver>ThemeWidgetForm</receiver>
   <slot>update_ui()</slot>
   <hints>
    <hint type="sourcelabel">
     <x>20</x>
     <y>20</y>
    </hint>
    <hint type="destinationlabel">
     <x>20</x>
     <y>20</y>
    </hint>
   </hints>
  </connection>
 </connections>
 <slots>
  <slot>update_ui()</slot>
 </slots>
</ui>