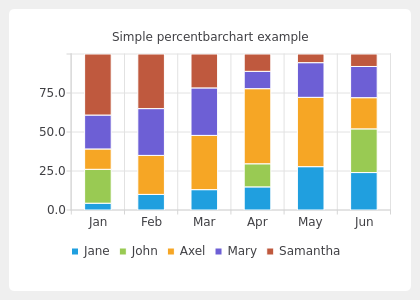
Percent Bar Chart Example
The example shows how to create a simple percent bar chart.
A percent bar chart shows the data in sets as a percentage of all sets per category.
Creating percent bar charts is just like creating a regular bar chart, except that for a percent bar charts, we use the QPercentBarSeries API instead of QBarSeries. Also, in the bar chart, we used the nice numbers algorithm to make the y-axis numbering look better. With the percent bar chart there is no need for that, because the maximum y-axis value is always 100.
# Copyright (C) 2022 The Qt Company Ltd.
# SPDX-License-Identifier: LicenseRef-Qt-Commercial OR BSD-3-Clause
from __future__ import annotations

"""PySide6 port of the Percent Bar Chart example from Qt v5.x"""

import sys
from PySide6.QtCore import Qt
from PySide6.QtGui import QPainter
from PySide6.QtWidgets import (QMainWindow, QApplication)
from PySide6.QtCharts import (QBarCategoryAxis, QBarSet, QChart, QChartView,
                              QPercentBarSeries)


class MainWindow(QMainWindow):
    def __init__(self):
        super().__init__()

        set0 = QBarSet("Jane")
        set1 = QBarSet("John")
        set2 = QBarSet("Axel")
        set3 = QBarSet("Mary")
        set4 = QBarSet("Samantha")

        set0.append([1, 2, 3, 4, 5, 6])
        set1.append([5, 0, 0, 4, 0, 7])
        set2.append([3, 5, 8, 13, 8, 5])
        set3.append([5, 6, 7, 3, 4, 5])
        set4.append([9, 7, 5, 3, 1, 2])

        series = QPercentBarSeries()
        series.append(set0)
        series.append(set1)
        series.append(set2)
        series.append(set3)
        series.append(set4)

        chart = QChart()
        chart.addSeries(series)
        chart.setTitle("Simple percentbarchart example")
        chart.setAnimationOptions(QChart.SeriesAnimations)

        categories = ["Jan", "Feb", "Mar", "Apr", "May", "Jun"]
        axis = QBarCategoryAxis()
        axis.append(categories)
        chart.createDefaultAxes()
        chart.addAxis(axis, Qt.AlignBottom)
        series.attachAxis(axis)

        chart.legend().setVisible(True)
        chart.legend().setAlignment(Qt.AlignBottom)

        chart_view = QChartView(chart)
        chart_view.setRenderHint(QPainter.RenderHint.Antialiasing)

        self.setCentralWidget(chart_view)


if __name__ == "__main__":
    app = QApplication(sys.argv)
    w = MainWindow()
    w.resize(420, 300)
    w.show()
    sys.exit(app.exec())