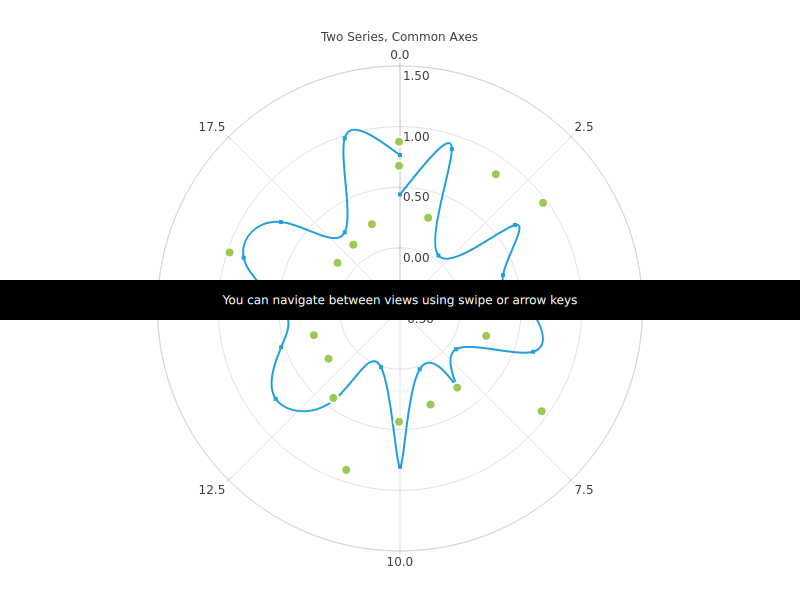
QML Polar Chart Example
This is a demonstration on how to use a polar chart in your QML application.
// Copyright (C) 2016 The Qt Company Ltd.
// SPDX-License-Identifier: LicenseRef-Qt-Commercial OR BSD-3-Clause

import QtQuick
import QtCharts

Item {
    anchors.fill: parent
    //![1]
    PolarChartView {
        title: "Two Series, Common Axes"
        anchors.fill: parent
        legend.visible: false
        antialiasing: true

        ValueAxis {
            id: axisAngular
            min: 0
            max: 20
            tickCount: 9
        }

        ValueAxis {
            id: axisRadial
            min: -0.5
            max: 1.5
        }

        SplineSeries {
            id: series1
            axisAngular: axisAngular
            axisRadial: axisRadial
            pointsVisible: true
        }

        ScatterSeries {
            id: series2
            axisAngular: axisAngular
            axisRadial: axisRadial
            markerSize: 10
        }
    }

    // Add data dynamically to the series
    Component.onCompleted: {
        for (var i = 0; i <= 20; i++) {
            series1.append(i, Math.random());
            series2.append(i, Math.random());
        }
    }
    //![1]
}
// Copyright (C) 2016 The Qt Company Ltd.
// SPDX-License-Identifier: LicenseRef-Qt-Commercial OR BSD-3-Clause

import QtQuick
import QtCharts

Item {
    anchors.fill: parent

    //![1]
    PolarChartView {
        title: "Historical Area Series"
        anchors.fill: parent
        legend.visible: false
        antialiasing: true

        DateTimeAxis {
            id: axis1
            format: "yyyy MMM"
            tickCount: 13
        }
        ValueAxis {
            id: axis2
        }
        LineSeries {
            id: lowerLine
            axisAngular: axis1
            axisRadial: axis2

            // Please note that month in JavaScript months are zero based, so 2 means March
            XYPoint { x: toMsecsSinceEpoch(new Date(1950, 0, 1)); y: 15 }
            XYPoint { x: toMsecsSinceEpoch(new Date(1962, 4, 1)); y: 35 }
            XYPoint { x: toMsecsSinceEpoch(new Date(1970, 0, 1)); y: 50 }
            XYPoint { x: toMsecsSinceEpoch(new Date(1978, 2, 1)); y: 75 }
            XYPoint { x: toMsecsSinceEpoch(new Date(1987, 11, 1)); y: 102 }
            XYPoint { x: toMsecsSinceEpoch(new Date(1992, 1, 1)); y: 132 }
            XYPoint { x: toMsecsSinceEpoch(new Date(1998, 7, 1)); y: 100 }
            XYPoint { x: toMsecsSinceEpoch(new Date(2002, 4, 1)); y: 120 }
            XYPoint { x: toMsecsSinceEpoch(new Date(2012, 8, 1)); y: 140 }
            XYPoint { x: toMsecsSinceEpoch(new Date(2013, 5, 1)); y: 150 }
        }
        LineSeries {
            id: upperLine
            axisAngular: axis1
            axisRadial: axis2

            // Please note that month in JavaScript months are zero based, so 2 means March
            XYPoint { x: toMsecsSinceEpoch(new Date(1950, 0, 1)); y: 30 }
            XYPoint { x: toMsecsSinceEpoch(new Date(1962, 4, 1)); y: 55 }
            XYPoint { x: toMsecsSinceEpoch(new Date(1970, 0, 1)); y: 80 }
            XYPoint { x: toMsecsSinceEpoch(new Date(1978, 2, 1)); y: 105 }
            XYPoint { x: toMsecsSinceEpoch(new Date(1987, 11, 1)); y: 125 }
            XYPoint { x: toMsecsSinceEpoch(new Date(1992, 1, 1)); y: 160 }
            XYPoint { x: toMsecsSinceEpoch(new Date(1998, 7, 1)); y: 140 }
            XYPoint { x: toMsecsSinceEpoch(new Date(2002, 4, 1)); y: 140 }
            XYPoint { x: toMsecsSinceEpoch(new Date(2012, 8, 1)); y: 170 }
            XYPoint { x: toMsecsSinceEpoch(new Date(2013, 5, 1)); y: 200 }
        }
        AreaSeries {
            axisAngular: axis1
            axisRadial: axis2
            lowerSeries: lowerLine
            upperSeries: upperLine
        }
    }
    // DateTimeAxis is based on QDateTimes so we must convert our JavaScript dates to
    // milliseconds since epoch to make them match the DateTimeAxis values
    function toMsecsSinceEpoch(date) {
        var msecs = date.getTime();
        return msecs;
    }
    //![1]
}
// Copyright (C) 2016 The Qt Company Ltd.
// SPDX-License-Identifier: LicenseRef-Qt-Commercial OR BSD-3-Clause

import QtQuick
import QtCharts

Item {
    anchors.fill: parent

    //![1]
    PolarChartView {
        title: "Numerical Data for Dummies"
        anchors.fill: parent
        legend.visible: false
        antialiasing: true

        LineSeries {
            axisRadial: CategoryAxis {
                min: 0
                max: 30
                CategoryRange {
                    label: "critical"
                    endValue: 2
                }
                CategoryRange {
                    label: "low"
                    endValue: 7
                }
                CategoryRange {
                    label: "normal"
                    endValue: 12
                }
                CategoryRange {
                    label: "high"
                    endValue: 18
                }
                CategoryRange {
                    label: "extremely high"
                    endValue: 30
                }
            }

            axisAngular: ValueAxis {
                tickCount: 13
            }

            XYPoint { x: 0; y: 4.3 }
            XYPoint { x: 1; y: 4.1 }
            XYPoint { x: 2; y: 4.7 }
            XYPoint { x: 3; y: 3.9 }
            XYPoint { x: 4; y: 5.2 }
            XYPoint { x: 5; y: 5.3 }
            XYPoint { x: 6; y: 6.1 }
            XYPoint { x: 7; y: 7.7 }
            XYPoint { x: 8; y: 12.9 }
            XYPoint { x: 9; y: 19.2 }
        }
    }
    //![1]
}
// Copyright (C) 2016 The Qt Company Ltd.
// SPDX-License-Identifier: LicenseRef-Qt-Commercial OR BSD-3-Clause

import QtQuick

Item {
    width: 800
    height: 600
    property bool sourceLoaded: false

    ListView {
        id: root
        focus: true
        anchors.fill: parent
        snapMode: ListView.SnapOneItem
        highlightRangeMode: ListView.StrictlyEnforceRange
        highlightMoveDuration: 250
        orientation: ListView.Horizontal
        boundsBehavior: Flickable.StopAtBounds

        onCurrentIndexChanged: {
            if (infoText.opacity > 0.0) {
                if (sourceLoaded)
                    infoText.opacity = 0.0;
                else if (currentIndex != 0)
                    currentIndex = 0;
            }
        }

        model: ListModel {
            ListElement {component: "View1.qml"}
            ListElement {component: "View2.qml"}
            ListElement {component: "View3.qml"}
        }

        delegate: Loader {
            width: root.width
            height: root.height

            source: component
            asynchronous: true

            onLoaded: sourceLoaded = true
        }
    }

    Rectangle {
        id: infoText
        anchors.centerIn: parent
        width: parent.width
        height: 40
        color: "black"
        Text {
            color: "white"
            anchors.centerIn: parent
            text: "You can navigate between views using swipe or arrow keys"
        }

        Behavior on opacity {
            NumberAnimation { duration: 400 }
        }
    }
}
# Copyright (C) 2022 The Qt Company Ltd.
# SPDX-License-Identifier: LicenseRef-Qt-Commercial OR BSD-3-Clause
from __future__ import annotations

"""PySide6 port of the QML Polar Chart Example from Qt v5.x"""

import os
from pathlib import Path
import sys

from PySide6.QtQuick import QQuickView
from PySide6.QtCore import QUrl
from PySide6.QtWidgets import QApplication


if __name__ == '__main__':
    app = QApplication(sys.argv)
    viewer = QQuickView()

    src_dir = Path(__file__).resolve().parent
    viewer.engine().addImportPath(os.fspath(src_dir))
    viewer.engine().quit.connect(viewer.close)

    viewer.setTitle = "QML Polar Chart"
    viewer.setSource(QUrl.fromLocalFile(src_dir / 'main.qml'))
    viewer.setResizeMode(QQuickView.SizeRootObjectToView)
    viewer.show()

    sys.exit(app.exec())