Surface Example
Using Q3DSurface in a widget application.
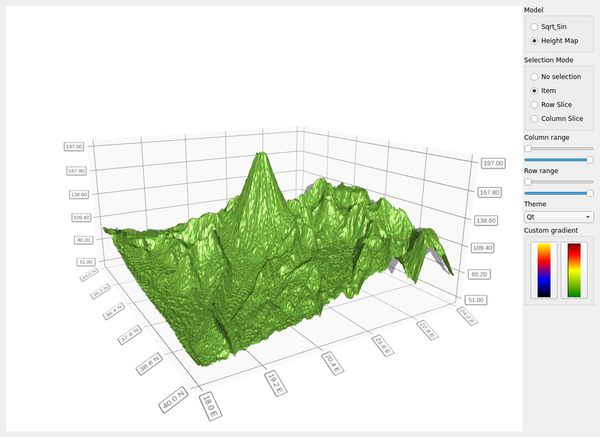
The surface example shows how to make a simple 3D surface graph using Q3DSurface and combining the use of widgets for adjusting several adjustable qualities. This example demonstrates the following features:
How to set up a basic QSurfaceDataProxy and set data for it.
How to use QHeightMapSurfaceDataProxy for showing 3D height maps.
Three different selection modes for studying the graph.
Axis range usage for displaying selected portions of the graph.
Changing theme.
How to set a custom surface gradient.
For instructions about how to interact with the graph, see this page.
# Copyright (C) 2022 The Qt Company Ltd.
# SPDX-License-Identifier: LicenseRef-Qt-Commercial OR BSD-3-Clause
from __future__ import annotations

import sys

from PySide6.QtCore import QSize, Qt
from PySide6.QtDataVisualization import Q3DSurface
from PySide6.QtGui import QBrush, QIcon, QLinearGradient, QPainter, QPixmap
from PySide6.QtWidgets import (QApplication, QComboBox, QGroupBox, QHBoxLayout,
                               QLabel, QMessageBox, QPushButton, QRadioButton,
                               QSizePolicy, QSlider, QVBoxLayout, QWidget)

from surfacegraph import SurfaceGraph

THEMES = ["Qt", "Primary Colors", "Digia", "Stone Moss", "Army Blue", "Retro",
          "Ebony", "Isabelle"]


class Window(QWidget):
    def __init__(self, graph, parent=None):
        super().__init__(parent)
        self._graph = graph
        self._container = QWidget.createWindowContainer(self._graph, self,
                                                        Qt.Widget)

        screen_size = self._graph.screen().size()
        self._container.setMinimumSize(QSize(screen_size.width() / 2,
                                       screen_size.height() / 1.6))
        self._container.setMaximumSize(screen_size)
        self._container.setSizePolicy(QSizePolicy.Expanding,
                                      QSizePolicy.Expanding)
        self._container.setFocusPolicy(Qt.StrongFocus)

        h_layout = QHBoxLayout(self)
        v_layout = QVBoxLayout()
        h_layout.addWidget(self._container, 1)
        h_layout.addLayout(v_layout)
        v_layout.setAlignment(Qt.AlignTop)

        model_group_box = QGroupBox("Model")

        sqrt_sin_model_rb = QRadioButton(self)
        sqrt_sin_model_rb.setText("Sqrt& Sin")
        sqrt_sin_model_rb.setChecked(False)

        height_map_model_rb = QRadioButton(self)
        height_map_model_rb.setText("Height Map")
        height_map_model_rb.setChecked(False)

        model_vbox = QVBoxLayout()
        model_vbox.addWidget(sqrt_sin_model_rb)
        model_vbox.addWidget(height_map_model_rb)
        model_group_box.setLayout(model_vbox)

        selection_group_box = QGroupBox("Selection Mode")

        mode_none_rb = QRadioButton(self)
        mode_none_rb.setText("No selection")
        mode_none_rb.setChecked(False)

        mode_item_rb = QRadioButton(self)
        mode_item_rb.setText("Item")
        mode_item_rb.setChecked(False)

        mode_slice_row_rb = QRadioButton(self)
        mode_slice_row_rb.setText("Row Slice")
        mode_slice_row_rb.setChecked(False)

        mode_slice_column_rb = QRadioButton(self)
        mode_slice_column_rb.setText("Column Slice")
        mode_slice_column_rb.setChecked(False)

        selection_vbox = QVBoxLayout()
        selection_vbox.addWidget(mode_none_rb)
        selection_vbox.addWidget(mode_item_rb)
        selection_vbox.addWidget(mode_slice_row_rb)
        selection_vbox.addWidget(mode_slice_column_rb)
        selection_group_box.setLayout(selection_vbox)

        axis_min_slider_x = QSlider(Qt.Orientation.Horizontal, self)
        axis_min_slider_x.setMinimum(0)
        axis_min_slider_x.setTickInterval(1)
        axis_min_slider_x.setEnabled(True)
        axis_max_slider_x = QSlider(Qt.Orientation.Horizontal, self)
        axis_max_slider_x.setMinimum(1)
        axis_max_slider_x.setTickInterval(1)
        axis_max_slider_x.setEnabled(True)
        axis_min_slider_z = QSlider(Qt.Orientation.Horizontal, self)
        axis_min_slider_z.setMinimum(0)
        axis_min_slider_z.setTickInterval(1)
        axis_min_slider_z.setEnabled(True)
        axis_max_slider_z = QSlider(Qt.Orientation.Horizontal, self)
        axis_max_slider_z.setMinimum(1)
        axis_max_slider_z.setTickInterval(1)
        axis_max_slider_z.setEnabled(True)

        theme_list = QComboBox(self)
        theme_list.addItems(THEMES)

        color_group_box = QGroupBox("Custom gradient")

        gr_bto_y = QLinearGradient(0, 0, 1, 100)
        gr_bto_y.setColorAt(1.0, Qt.black)
        gr_bto_y.setColorAt(0.67, Qt.blue)
        gr_bto_y.setColorAt(0.33, Qt.red)
        gr_bto_y.setColorAt(0.0, Qt.yellow)

        pm = QPixmap(24, 100)
        pmp = QPainter(pm)
        pmp.setBrush(QBrush(gr_bto_y))
        pmp.setPen(Qt.NoPen)
        pmp.drawRect(0, 0, 24, 100)
        pmp.end()

        gradient_bto_ypb = QPushButton(self)
        gradient_bto_ypb.setIcon(QIcon(pm))
        gradient_bto_ypb.setIconSize(QSize(24, 100))

        gr_gto_r = QLinearGradient(0, 0, 1, 100)
        gr_gto_r.setColorAt(1.0, Qt.darkGreen)
        gr_gto_r.setColorAt(0.5, Qt.yellow)
        gr_gto_r.setColorAt(0.2, Qt.red)
        gr_gto_r.setColorAt(0.0, Qt.darkRed)
        pmp.begin(pm)
        pmp.setBrush(QBrush(gr_gto_r))
        pmp.drawRect(0, 0, 24, 100)
        pmp.end()

        gradient_gto_rpb = QPushButton(self)
        gradient_gto_rpb.setIcon(QIcon(pm))
        gradient_gto_rpb.setIconSize(QSize(24, 100))

        color_hbox = QHBoxLayout()
        color_hbox.addWidget(gradient_bto_ypb)
        color_hbox.addWidget(gradient_gto_rpb)
        color_group_box.setLayout(color_hbox)

        v_layout.addWidget(model_group_box)
        v_layout.addWidget(selection_group_box)
        v_layout.addWidget(QLabel("Column range"))
        v_layout.addWidget(axis_min_slider_x)
        v_layout.addWidget(axis_max_slider_x)
        v_layout.addWidget(QLabel("Row range"))
        v_layout.addWidget(axis_min_slider_z)
        v_layout.addWidget(axis_max_slider_z)
        v_layout.addWidget(QLabel("Theme"))
        v_layout.addWidget(theme_list)
        v_layout.addWidget(color_group_box)

        self._modifier = SurfaceGraph(self._graph)

        height_map_model_rb.toggled.connect(self._modifier.enable_height_map_model)
        sqrt_sin_model_rb.toggled.connect(self._modifier.enable_sqrt_sin_model)
        mode_none_rb.toggled.connect(self._modifier.toggle_mode_none)
        mode_item_rb.toggled.connect(self._modifier.toggle_mode_item)
        mode_slice_row_rb.toggled.connect(self._modifier.toggle_mode_slice_row)
        mode_slice_column_rb.toggled.connect(self._modifier.toggle_mode_slice_column)
        axis_min_slider_x.valueChanged.connect(self._modifier.adjust_xmin)
        axis_max_slider_x.valueChanged.connect(self._modifier.adjust_xmax)
        axis_min_slider_z.valueChanged.connect(self._modifier.adjust_zmin)
        axis_max_slider_z.valueChanged.connect(self._modifier.adjust_zmax)
        theme_list.currentIndexChanged[int].connect(self._modifier.change_theme)
        gradient_bto_ypb.pressed.connect(self._modifier.set_black_to_yellow_gradient)
        gradient_gto_rpb.pressed.connect(self._modifier.set_green_to_red_gradient)

        self._modifier.set_axis_min_slider_x(axis_min_slider_x)
        self._modifier.set_axis_max_slider_x(axis_max_slider_x)
        self._modifier.set_axis_min_slider_z(axis_min_slider_z)
        self._modifier.set_axis_max_slider_z(axis_max_slider_z)

        sqrt_sin_model_rb.setChecked(True)
        mode_item_rb.setChecked(True)
        theme_list.setCurrentIndex(2)


if __name__ == "__main__":
    app = QApplication(sys.argv)
    graph = Q3DSurface()
    if not graph.hasContext():
        msg_box = QMessageBox()
        msg_box.setText("Couldn't initialize the OpenGL context.")
        msg_box.exec()
        sys.exit(-1)

    window = Window(graph)
    window.setWindowTitle("Surface example")
    window.show()

    sys.exit(app.exec())
# Copyright (C) 2022 The Qt Company Ltd.
# SPDX-License-Identifier: LicenseRef-Qt-Commercial OR BSD-3-Clause
from __future__ import annotations

import math
from pathlib import Path

from PySide6.QtCore import QObject, Qt, Slot
from PySide6.QtDataVisualization import (Q3DTheme, QAbstract3DGraph,
                                         QHeightMapSurfaceDataProxy,
                                         QSurface3DSeries, QSurfaceDataItem,
                                         QSurfaceDataProxy, QValue3DAxis)
from PySide6.QtGui import QImage, QLinearGradient, QVector3D
from PySide6.QtWidgets import QSlider

SAMPLE_COUNT_X = 50
SAMPLE_COUNT_Z = 50
HEIGHT_MAP_GRID_STEP_X = 6
HEIGHT_MAP_GRID_STEP_Z = 6
SAMPLE_MIN = -8.0
SAMPLE_MAX = 8.0


class SurfaceGraph(QObject):
    def __init__(self, surface, parent=None):
        super().__init__(parent)

        self._graph = surface
        self._graph.setAxisX(QValue3DAxis())
        self._graph.setAxisY(QValue3DAxis())
        self._graph.setAxisZ(QValue3DAxis())

        self._sqrtSinProxy = QSurfaceDataProxy()
        self._sqrtSinSeries = QSurface3DSeries(self._sqrtSinProxy)
        self.fill_sqrt_sin_proxy()

        image_file = Path(__file__).parent / "mountain.png"
        height_map_image = QImage(image_file)
        self._heightMapProxy = QHeightMapSurfaceDataProxy(height_map_image)
        self._heightMapSeries = QSurface3DSeries(self._heightMapProxy)
        self._heightMapSeries.setItemLabelFormat("(@xLabel, @zLabel): @yLabel")
        self._heightMapProxy.setValueRanges(34.0, 40.0, 18.0, 24.0)

        self._heightMapWidth = height_map_image.width()
        self._heightMapHeight = height_map_image.height()

        self._axisMinSliderX = QSlider()
        self._axisMaxSliderX = QSlider()
        self._axisMinSliderZ = QSlider()
        self._axisMaxSliderZ = QSlider()
        self._rangeMinX = 0.0
        self._rangeMinZ = 0.0
        self._stepX = 0.0
        self._stepZ = 0.0

    def fill_sqrt_sin_proxy(self):
        step_x = (SAMPLE_MAX - SAMPLE_MIN) / float(SAMPLE_COUNT_X - 1)
        step_z = (SAMPLE_MAX - SAMPLE_MIN) / float(SAMPLE_COUNT_Z - 1)

        data_array = []
        for i in range(SAMPLE_COUNT_Z):
            new_row = []
            # Keep values within range bounds, since just adding step can cause
            # minor drift due to the rounding errors.
            z = min(SAMPLE_MAX, (i * step_z + SAMPLE_MIN))
            for j in range(SAMPLE_COUNT_X):
                x = min(SAMPLE_MAX, (j * step_x + SAMPLE_MIN))
                R = math.sqrt(z * z + x * x) + 0.01
                y = (math.sin(R) / R + 0.24) * 1.61
                new_row.append(QSurfaceDataItem(QVector3D(x, y, z)))
            data_array.append(new_row)

        self._sqrtSinProxy.resetArray(data_array)

    @Slot(bool)
    def enable_sqrt_sin_model(self, enable):
        if enable:
            self._sqrtSinSeries.setDrawMode(QSurface3DSeries.DrawSurfaceAndWireframe)
            self._sqrtSinSeries.setFlatShadingEnabled(True)

            self._graph.axisX().setLabelFormat("%.2f")
            self._graph.axisZ().setLabelFormat("%.2f")
            self._graph.axisX().setRange(SAMPLE_MIN, SAMPLE_MAX)
            self._graph.axisY().setRange(0.0, 2.0)
            self._graph.axisZ().setRange(SAMPLE_MIN, SAMPLE_MAX)
            self._graph.axisX().setLabelAutoRotation(30)
            self._graph.axisY().setLabelAutoRotation(90)
            self._graph.axisZ().setLabelAutoRotation(30)

            self._graph.removeSeries(self._heightMapSeries)
            self._graph.addSeries(self._sqrtSinSeries)

            # Reset range sliders for Sqrt&Sin
            self._rangeMinX = SAMPLE_MIN
            self._rangeMinZ = SAMPLE_MIN
            self._stepX = (SAMPLE_MAX - SAMPLE_MIN) / float(SAMPLE_COUNT_X - 1)
            self._stepZ = (SAMPLE_MAX - SAMPLE_MIN) / float(SAMPLE_COUNT_Z - 1)
            self._axisMinSliderX.setMaximum(SAMPLE_COUNT_X - 2)
            self._axisMinSliderX.setValue(0)
            self._axisMaxSliderX.setMaximum(SAMPLE_COUNT_X - 1)
            self._axisMaxSliderX.setValue(SAMPLE_COUNT_X - 1)
            self._axisMinSliderZ.setMaximum(SAMPLE_COUNT_Z - 2)
            self._axisMinSliderZ.setValue(0)
            self._axisMaxSliderZ.setMaximum(SAMPLE_COUNT_Z - 1)
            self._axisMaxSliderZ.setValue(SAMPLE_COUNT_Z - 1)

    @Slot(bool)
    def enable_height_map_model(self, enable):
        if enable:
            self._heightMapSeries.setDrawMode(QSurface3DSeries.DrawSurface)
            self._heightMapSeries.setFlatShadingEnabled(False)

            self._graph.axisX().setLabelFormat("%.1f N")
            self._graph.axisZ().setLabelFormat("%.1f E")
            self._graph.axisX().setRange(34.0, 40.0)
            self._graph.axisY().setAutoAdjustRange(True)
            self._graph.axisZ().setRange(18.0, 24.0)

            self._graph.axisX().setTitle("Latitude")
            self._graph.axisY().setTitle("Height")
            self._graph.axisZ().setTitle("Longitude")

            self._graph.removeSeries(self._sqrtSinSeries)
            self._graph.addSeries(self._heightMapSeries)

            # Reset range sliders for height map
            map_grid_count_x = self._heightMapWidth / HEIGHT_MAP_GRID_STEP_X
            map_grid_count_z = self._heightMapHeight / HEIGHT_MAP_GRID_STEP_Z
            self._rangeMinX = 34.0
            self._rangeMinZ = 18.0
            self._stepX = 6.0 / float(map_grid_count_x - 1)
            self._stepZ = 6.0 / float(map_grid_count_z - 1)
            self._axisMinSliderX.setMaximum(map_grid_count_x - 2)
            self._axisMinSliderX.setValue(0)
            self._axisMaxSliderX.setMaximum(map_grid_count_x - 1)
            self._axisMaxSliderX.setValue(map_grid_count_x - 1)
            self._axisMinSliderZ.setMaximum(map_grid_count_z - 2)
            self._axisMinSliderZ.setValue(0)
            self._axisMaxSliderZ.setMaximum(map_grid_count_z - 1)
            self._axisMaxSliderZ.setValue(map_grid_count_z - 1)

    @Slot(int)
    def adjust_xmin(self, minimum):
        min_x = self._stepX * float(minimum) + self._rangeMinX

        maximum = self._axisMaxSliderX.value()
        if minimum >= maximum:
            maximum = minimum + 1
            self._axisMaxSliderX.setValue(maximum)
        max_x = self._stepX * maximum + self._rangeMinX

        self.set_axis_xrange(min_x, max_x)

    @Slot(int)
    def adjust_xmax(self, maximum):
        max_x = self._stepX * float(maximum) + self._rangeMinX

        minimum = self._axisMinSliderX.value()
        if maximum <= minimum:
            minimum = maximum - 1
            self._axisMinSliderX.setValue(minimum)
        min_x = self._stepX * minimum + self._rangeMinX

        self.set_axis_xrange(min_x, max_x)

    @Slot(int)
    def adjust_zmin(self, minimum):
        min_z = self._stepZ * float(minimum) + self._rangeMinZ

        maximum = self._axisMaxSliderZ.value()
        if minimum >= maximum:
            maximum = minimum + 1
            self._axisMaxSliderZ.setValue(maximum)
        max_z = self._stepZ * maximum + self._rangeMinZ

        self.set_axis_zrange(min_z, max_z)

    @Slot(int)
    def adjust_zmax(self, maximum):
        max_x = self._stepZ * float(maximum) + self._rangeMinZ

        minimum = self._axisMinSliderZ.value()
        if maximum <= minimum:
            minimum = maximum - 1
            self._axisMinSliderZ.setValue(minimum)
        min_x = self._stepZ * minimum + self._rangeMinZ

        self.set_axis_zrange(min_x, max_x)

    def set_axis_xrange(self, minimum, maximum):
        self._graph.axisX().setRange(minimum, maximum)

    def set_axis_zrange(self, minimum, maximum):
        self._graph.axisZ().setRange(minimum, maximum)

    @Slot(int)
    def change_theme(self, theme):
        self._graph.activeTheme().setType(Q3DTheme.Theme(theme))

    @Slot()
    def set_black_to_yellow_gradient(self):
        gr = QLinearGradient()
        gr.setColorAt(0.0, Qt.black)
        gr.setColorAt(0.33, Qt.blue)
        gr.setColorAt(0.67, Qt.red)
        gr.setColorAt(1.0, Qt.yellow)

        series = self._graph.seriesList()[0]
        series.setBaseGradient(gr)
        series.setColorStyle(Q3DTheme.ColorStyleRangeGradient)

    @Slot()
    def set_green_to_red_gradient(self):
        gr = QLinearGradient()
        gr.setColorAt(0.0, Qt.darkGreen)
        gr.setColorAt(0.5, Qt.yellow)
        gr.setColorAt(0.8, Qt.red)
        gr.setColorAt(1.0, Qt.darkRed)

        series = self._graph.seriesList()[0]
        series.setBaseGradient(gr)
        series.setColorStyle(Q3DTheme.ColorStyleRangeGradient)

    @Slot()
    def toggle_mode_none(self):
        self._graph.setSelectionMode(QAbstract3DGraph.SelectionNone)

    @Slot()
    def toggle_mode_item(self):
        self._graph.setSelectionMode(QAbstract3DGraph.SelectionItem)

    @Slot()
    def toggle_mode_slice_row(self):
        self._graph.setSelectionMode(
            QAbstract3DGraph.SelectionItemAndRow | QAbstract3DGraph.SelectionSlice
        )

    @Slot()
    def toggle_mode_slice_column(self):
        self._graph.setSelectionMode(
            QAbstract3DGraph.SelectionItemAndColumn | QAbstract3DGraph.SelectionSlice
        )

    def set_axis_min_slider_x(self, slider):
        self._axisMinSliderX = slider

    def set_axis_max_slider_x(self, slider):
        self._axisMaxSliderX = slider

    def set_axis_min_slider_z(self, slider):
        self._axisMinSliderZ = slider

    def set_axis_max_slider_z(self, slider):
        self._axisMaxSliderZ = slider