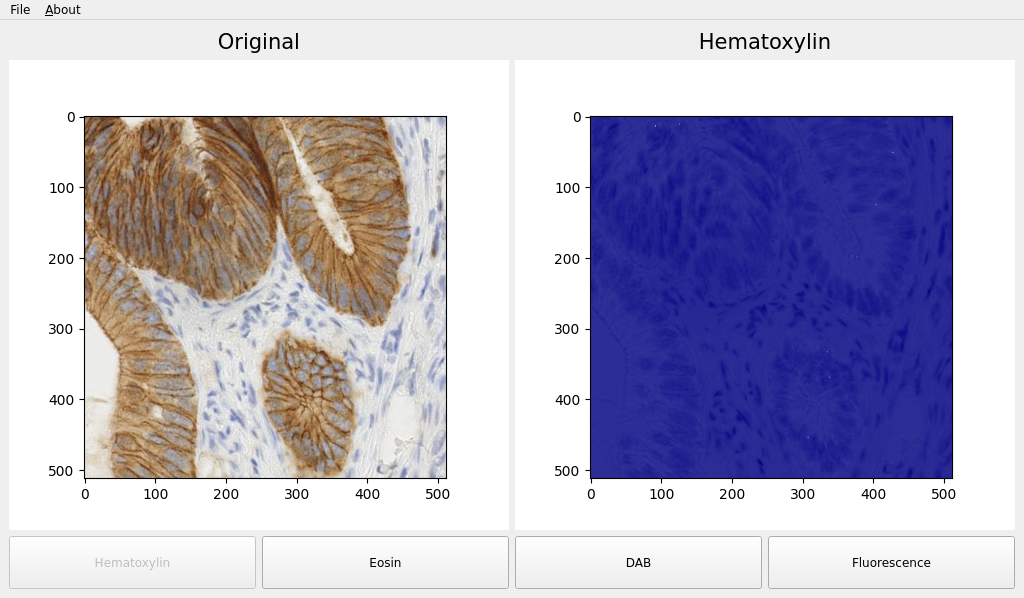
Scikit Image Example
A Python application that demonstrates how to use Scikit Image to apply filters to images based on a Qt Widgets.
# Copyright (C) 2022 The Qt Company Ltd.
# SPDX-License-Identifier: LicenseRef-Qt-Commercial OR BSD-3-Clause
from __future__ import annotations

import sys

import numpy as np
from matplotlib.backends.backend_qt5agg import FigureCanvas
from matplotlib.colors import LinearSegmentedColormap
from matplotlib.figure import Figure
from PySide6.QtCore import Qt, Slot
from PySide6.QtGui import QAction, QKeySequence
from PySide6.QtWidgets import (QApplication, QHBoxLayout, QLabel,
                               QMainWindow, QPushButton, QSizePolicy,
                               QVBoxLayout, QWidget)
from skimage import data
from skimage.color import rgb2hed
from skimage.exposure import rescale_intensity


class ApplicationWindow(QMainWindow):
    """
    Example based on the example by 'scikit-image' gallery:
    "Immunohistochemical staining colors separation"
    https://scikit-image.org/docs/stable/auto_examples/color_exposure/plot_ihc_color_separation.html
    """

    def __init__(self, parent=None):
        QMainWindow.__init__(self, parent)
        self._main = QWidget()
        self.setCentralWidget(self._main)

        # Main menu bar
        self.menu = self.menuBar()
        self.menu_file = self.menu.addMenu("File")
        exit = QAction("Exit", self, triggered=qApp.quit)  # noqa: F821
        self.menu_file.addAction(exit)

        self.menu_about = self.menu.addMenu("&About")
        about = QAction("About Qt", self, shortcut=QKeySequence(QKeySequence.HelpContents),
                        triggered=qApp.aboutQt)  # noqa: F821
        self.menu_about.addAction(about)

        # Create an artificial color close to the original one
        self.ihc_rgb = data.immunohistochemistry()
        self.ihc_hed = rgb2hed(self.ihc_rgb)

        main_layout = QVBoxLayout(self._main)
        plot_layout = QHBoxLayout()
        button_layout = QHBoxLayout()
        label_layout = QHBoxLayout()

        self.canvas1 = FigureCanvas(Figure(figsize=(5, 5)))
        self.canvas2 = FigureCanvas(Figure(figsize=(5, 5)))

        self._ax1 = self.canvas1.figure.subplots()
        self._ax2 = self.canvas2.figure.subplots()

        self._ax1.imshow(self.ihc_rgb)

        plot_layout.addWidget(self.canvas1)
        plot_layout.addWidget(self.canvas2)

        self.button1 = QPushButton("Hematoxylin")
        self.button2 = QPushButton("Eosin")
        self.button3 = QPushButton("DAB")
        self.button4 = QPushButton("Fluorescence")

        self.button1.setSizePolicy(QSizePolicy.Preferred, QSizePolicy.Expanding)
        self.button2.setSizePolicy(QSizePolicy.Preferred, QSizePolicy.Expanding)
        self.button3.setSizePolicy(QSizePolicy.Preferred, QSizePolicy.Expanding)
        self.button4.setSizePolicy(QSizePolicy.Preferred, QSizePolicy.Expanding)

        self.button1.clicked.connect(self.plot_hematoxylin)
        self.button2.clicked.connect(self.plot_eosin)
        self.button3.clicked.connect(self.plot_dab)
        self.button4.clicked.connect(self.plot_final)

        self.label1 = QLabel("Original", alignment=Qt.AlignCenter)
        self.label2 = QLabel("", alignment=Qt.AlignCenter)

        font = self.label1.font()
        font.setPointSize(16)
        self.label1.setFont(font)
        self.label2.setFont(font)

        label_layout.addWidget(self.label1)
        label_layout.addWidget(self.label2)

        button_layout.addWidget(self.button1)
        button_layout.addWidget(self.button2)
        button_layout.addWidget(self.button3)
        button_layout.addWidget(self.button4)

        main_layout.addLayout(label_layout, 2)
        main_layout.addLayout(plot_layout, 88)
        main_layout.addLayout(button_layout, 10)

        # Default image
        self.plot_hematoxylin()

    def set_buttons_state(self, states):
        self.button1.setEnabled(states[0])
        self.button2.setEnabled(states[1])
        self.button3.setEnabled(states[2])
        self.button4.setEnabled(states[3])

    @Slot()
    def plot_hematoxylin(self):
        cmap_hema = LinearSegmentedColormap.from_list("mycmap", ["white", "navy"])
        self._ax2.imshow(self.ihc_hed[:, :, 0], cmap=cmap_hema)
        self.canvas2.draw()
        self.label2.setText("Hematoxylin")
        self.set_buttons_state((False, True, True, True))

    @Slot()
    def plot_eosin(self):
        cmap_eosin = LinearSegmentedColormap.from_list("mycmap", ["darkviolet", "white"])
        self._ax2.imshow(self.ihc_hed[:, :, 1], cmap=cmap_eosin)
        self.canvas2.draw()
        self.label2.setText("Eosin")
        self.set_buttons_state((True, False, True, True))

    @Slot()
    def plot_dab(self):
        cmap_dab = LinearSegmentedColormap.from_list("mycmap", ["white", "saddlebrown"])
        self._ax2.imshow(self.ihc_hed[:, :, 2], cmap=cmap_dab)
        self.canvas2.draw()
        self.label2.setText("DAB")
        self.set_buttons_state((True, True, False, True))

    @Slot()
    def plot_final(self):
        h = rescale_intensity(self.ihc_hed[:, :, 0], out_range=(0, 1))
        d = rescale_intensity(self.ihc_hed[:, :, 2], out_range=(0, 1))
        zdh = np.dstack((np.zeros_like(h), d, h))
        self._ax2.imshow(zdh)
        self.canvas2.draw()
        self.label2.setText("Stain separated image")
        self.set_buttons_state((True, True, True, False))


if __name__ == "__main__":

    app = QApplication(sys.argv)
    w = ApplicationWindow()
    w.show()
    app.exec()