
1. Introduction
This chapter covers the technical integration of the Axivion Suite with an IT infrastructure. An installation of the Axivion Suite provides the following components:
- Analysis agent
The tools to compile, link and analyze your source code. The compiler and linker are provided as direct replacements for the target compiler and linker to be driven from a project’s original build system. Additional tools analyze the resulting linked IR file and store the results in an analysis results file.
- Dashboard server
The web application serving the analysis results.
- User frontend
Your options for inspecting analysis results served by the dashboard server:
Your web browser (viewing the dashboard web interface),
Azure DevOps plugin,
CLion plugin,
Eclipse plugin,
Visual Studio Code plugin,
Visual Studio plugin.
For architecture modelling, analysis and inspection of architecture-level analysis results (including cycles, dead code and architecture checking):
Gravis
While it is possible to run the components on a single computer for evaluation and testing purposes, the Axivion Suite is explicitly developed for a multi user, multi operating system scenario. Multiple virtual or non-virtual machines can be involved. The typical use case is illustrated in Figure Integration of Axivion Suite with IT infrastructure.
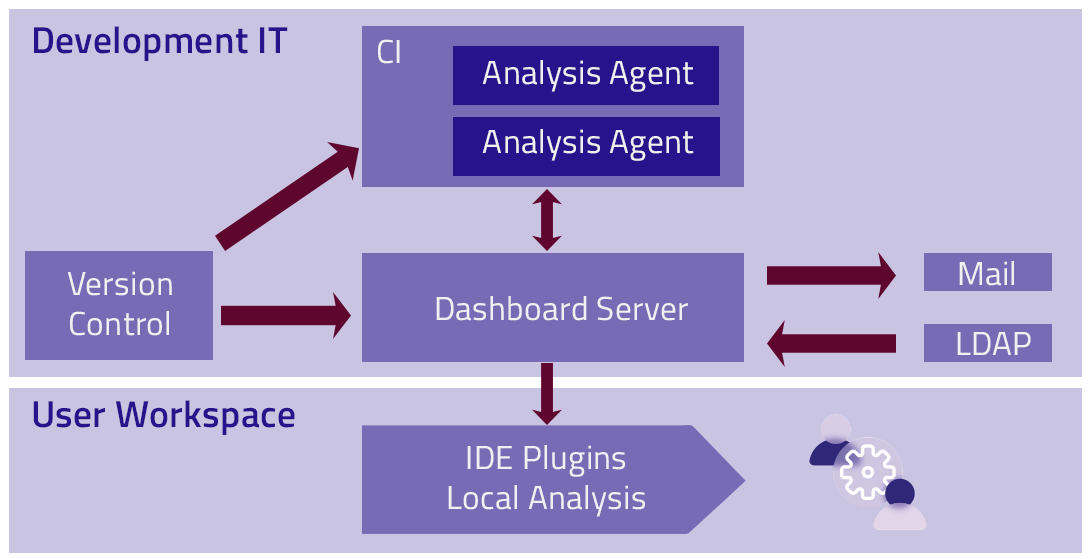
Integration of Axivion Suite with IT infrastructure
In the typical use case, the analysis aspect is integrated into a continuous integration system. This allows to schedule multiple analysis agents that run the analysis of one or more projects periodically or event-based. The Axivion Suite is independent of the choice of CI solution. Even a simple batch file can be sufficient. The steps to execute are:
check out a project’s source code from the version control system,
start the
axivion_citool that in turn triggers:build of the software via its normal build system, using the
cafeCCcompiler and linker frontend supplied by the Axivion Suite,analyze the software by executing the configured set of analysis rules, and upload the results to the dashboard server (alternatively the traditional way of writing the results to a file storage is also possible).
While there is the option to start the dashboard server only temporarily for a single user, typically it is installed as a system service. The dashboard server serves the analysis results of the projects at a configurable HTTP/HTTPS URL. Users can view the results by connecting to the dashboard (via HTTP/HTTPS) with a web browser or one of the IDE plugins.
The machines running the dashboard server, the build agents and the user frontend can all be separate virtual or non-virtual machines, or they can be running on the same machine. The Axivion Suite is built to integrate into the existing infrastructure.
The Section Installation Overview provides an overview of the steps required to set up the individual aspects. It highlights some integration choices that should be taken into consideration. Please start from this section to plan the integration and follow the references to find the detailed instructions.
The detailed system requirements for the individual aspects can be found in Section System Requirements.
If any questions remain or you find things not sufficiently documented, please do not hesitate to contact our support team.