
1.4. Dashboard Setup
This section covers the setup and configuration of the Axivion Dashboard Server. It gives a brief overview of the different Axivion topologies, then walks through the server installation and authentication configuration.
The Axivion Dashboard Server can be deployed in different topologies depending on your infrastructure requirements. The topology determines how the analysis agent, the dashboard server and the project databases relate to each other.
Note
Having projects with different topologies on the same dashboard instance may require extra configuration work, so it is worth considering your long-term needs before proceeding.
Managed upload on a single machine
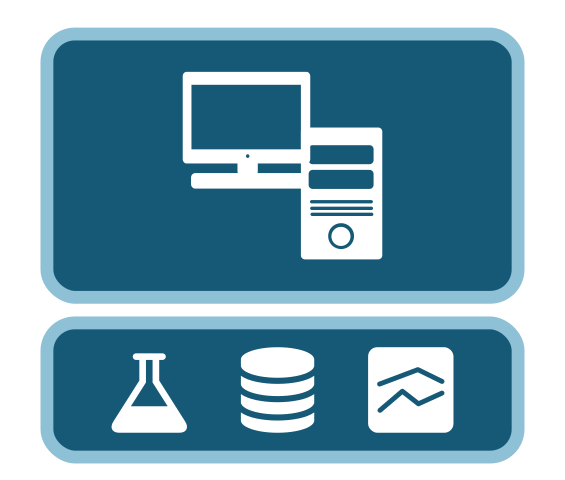
Analysis and dashboard server run on the same machine. The dashboard server manages the database.
This is the simplest topology and the one that is used on getting started. It is ideal for local proofs of concept, small projects or onboarding.
Managed upload to a central dashboard
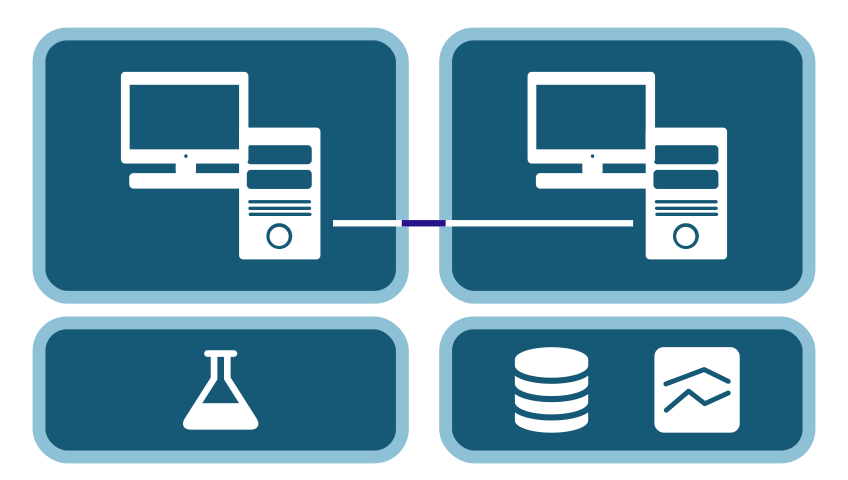
Analysis and dashboard server run on different machines. The dashboard server manages the database.
This topology is suited for setups where analysis agents run on CI machines and uploads results to a central dashboard that takes care of database management.
Shared database
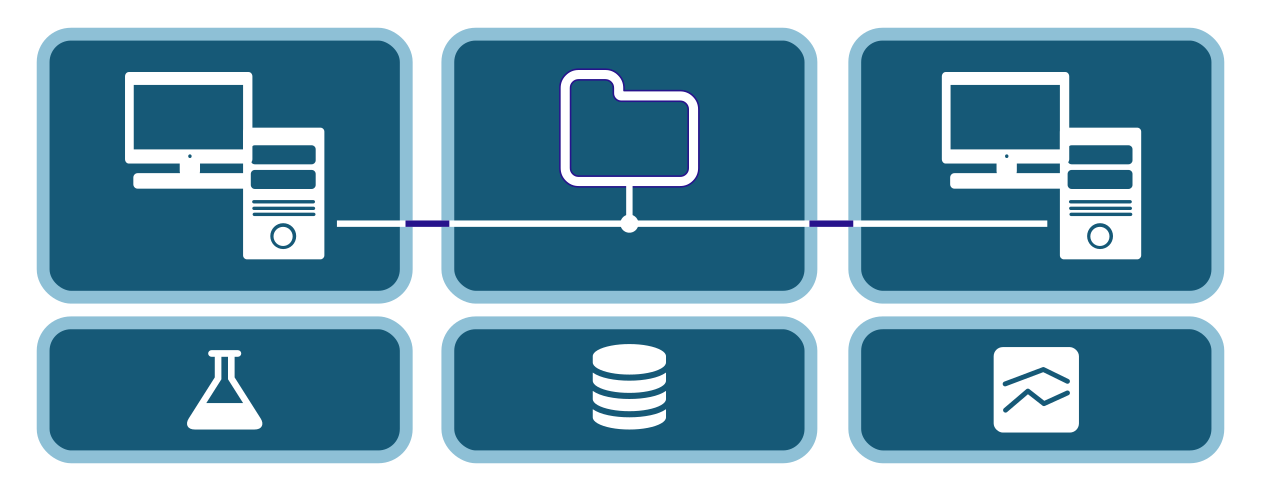
Analysis and dashboard server run on the same or on different machines. The database is stored in a shared network folder accessible by both.
This topology gives full control over database file placement and is suited for environments where a shared file system is already in place.
Caution
When starting new deployments, using shared_database is not recommended
as it will make certain workflows more complicated than necessary. Only use this
topology if you are aware of all its implications, or for legacy reasons e.g.
if the Axivion Suite used for the analysis is so old that it does not support
managed_upload.