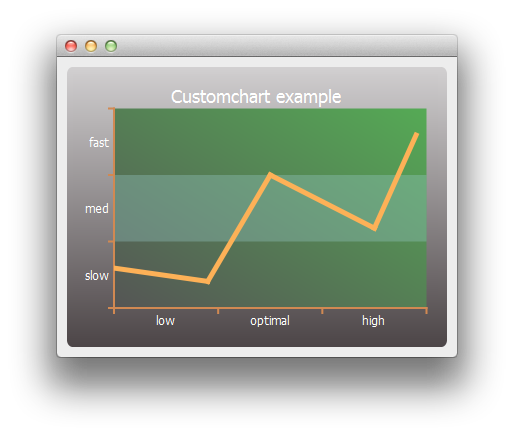
チャートのカスタマイズ
注: これはCharts with Widgets Galleryの例の一部です。

まず、単純な線分系列とチャート・オブジェクトを作成します。
auto series = new QLineSeries;
*series << QPointF(0, 6) << QPointF(9, 4) << QPointF(15, 20) << QPointF(25, 12) << QPointF(29, 26);
auto chart = new QChart;
chart->legend()->hide();
chart->addSeries(series);
まず、系列とチャートのタイトルと背景をカスタマイズします。
// Customize series
QPen pen(QRgb(0xfdb157));
pen.setWidth(5);
series->setPen(pen);

// Customize chart title
QFont font;
font.setPixelSize(18);
chart->setTitleFont(font);
chart->setTitleBrush(QBrush(Qt::white));
chart->setTitle("Custom Chart");

// Customize chart background
QLinearGradient backgroundGradient;
backgroundGradient.setStart(QPointF(0, 0));
backgroundGradient.setFinalStop(QPointF(0, 1));
backgroundGradient.setColorAt(0.0, QRgb(0xd2d0d1));
backgroundGradient.setColorAt(1.0, QRgb(0x4c4547));
backgroundGradient.setCoordinateMode(QGradient::ObjectBoundingMode);
chart->setBackgroundBrush(backgroundGradient);

// Customize plot area background
QLinearGradient plotAreaGradient;
plotAreaGradient.setStart(QPointF(0, 1));
plotAreaGradient.setFinalStop(QPointF(1, 0));
plotAreaGradient.setColorAt(0.0, QRgb(0x555555));
plotAreaGradient.setColorAt(1.0, QRgb(0x55aa55));
plotAreaGradient.setCoordinateMode(QGradient::ObjectBoundingMode);
chart->setPlotAreaBackgroundBrush(plotAreaGradient);
chart->setPlotAreaBackgroundVisible(true);
次に軸をカスタマイズします。
auto axisX = new QCategoryAxis;
auto axisY = new QCategoryAxis;

// Customize axis label font
QFont labelsFont;
labelsFont.setPixelSize(12);
axisX->setLabelsFont(labelsFont);
axisY->setLabelsFont(labelsFont);

// Customize axis colors
QPen axisPen(QRgb(0xd18952));
axisPen.setWidth(2);
axisX->setLinePen(axisPen);
axisY->setLinePen(axisPen);

// Customize axis label colors
QBrush axisBrush(Qt::white);
axisX->setLabelsBrush(axisBrush);
axisY->setLabelsBrush(axisBrush);

// Customize grid lines and shades
axisX->setGridLineVisible(false);
axisY->setGridLineVisible(false);
axisY->setShadesPen(Qt::NoPen);
axisY->setShadesBrush(QBrush(QColor(0x99, 0xcc, 0xcc, 0x55)));
axisY->setShadesVisible(true);
そして、軸ラベルの値と範囲を設定します。軸の準備ができたら、それをチャートで使用するように設定します。
axisX->append("low", 10);
axisX->append("optimal", 20);
axisX->append("high", 30);
axisX->setRange(0, 30);

axisY->append("slow", 10);
axisY->append("med", 20);
axisY->append("fast", 30);
axisY->setRange(0, 30);

chart->addAxis(axisX, Qt::AlignBottom);
chart->addAxis(axisY, Qt::AlignLeft);
series->attachAxis(axisX);
series->attachAxis(axisY);
最後に、チャートを含むビューを作成します。
createDefaultChartView(chart);
これで、メイン・ウィンドウにチャートを表示する準備が整いました。
© 2025 The Qt Company Ltd. Documentation contributions included herein are the copyrights of their respective owners. The documentation provided herein is licensed under the terms of the GNU Free Documentation License version 1.3 as published by the Free Software Foundation. Qt and respective logos are trademarks of The Qt Company Ltd. in Finland and/or other countries worldwide. All other trademarks are property of their respective owners.

