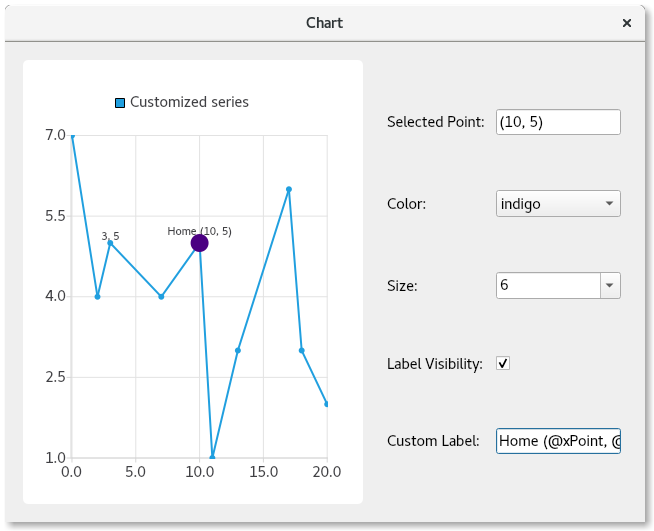
選択されたポイントの構成
注: これはCharts with Widgets Galleryの例の一部です。

デモンストレーションの機能
ここでは、以下の方法を学びます:
- シリーズ内のポイントのクリック選択を提供します。
- 特定のポイントの個別設定をオーバーライドする:
- 色
- サイズ
- ラベルの可視性
- ラベルのテキスト形式
例の実行
から例を実行するには Qt Creatorからサンプルを実行するには、Welcome モードを開き、Examples からサンプルを選択します。詳細については、Qt Creator:Tutorialを参照してください:ビルドと実行
QMainWindow のサブクラス
チャートとコントロールを含むQMainWindow のサブクラスを作成することから始めます。そして、コンストラクタ実装のためのボイラープレートを提供します:
PointConfigurationWidget::PointConfigurationWidget(QWidget *parent)
    : ContentWidget(parent)
{
線分系列の作成
次に、QLineSeries を作成し、名前を付け、ポイントを可視化し、プロットするポイントを与えます。
m_series = new QLineSeries;
m_series->setPointsVisible(true);
m_series->append({QPointF(0, 7),  QPointF(2, 4),
                  QPointF(3, 5),  QPointF(7, 4),
                  QPointF(10, 5), QPointF(11, 1),
                  QPointF(13, 3), QPointF(17, 6),
                  QPointF(18, 3), QPointF(20, 2)});
点構成コントロールの作成
次に、色、サイズ、ラベルの可視性、ラベル自体を設定するためのコントロールをいくつか作成します。各コントロールに関連するラベルを作成し、ユーザーがそのコントロールが何をするのかわかるようにします。
色とサイズについては、QComboBox を使用して、さまざまな色とサイズの選択肢を入力します。
次に、最後の2つのコントロールを作成します。チェックボックスは、選択されたポイントの可視性をコントロールします。もう1つのコントロールは、QLineEdit 、ユーザーがポイントにカスタムラベルを付けることができます。
ポイントは常に現在の設定で選択されるため、どのコントロールにも初期値を設定しないことに注意してください。
auto selectedPointIndexLabel = new QLabel(tr("Selected Point: "), this);
m_selectedPointIndexLineEdit = new QLineEdit(this);
m_selectedPointIndexLineEdit->setReadOnly(true);

auto colorLabel = new QLabel(tr("Color: "), this);
m_colorCombobox = new QComboBox(this);
QStringList colorStrings = {"red", "orange", "yellow", "green", "blue",
                            "indigo", "violet", "black"};
QStringList trColorStrings = {tr("red"), tr("orange"), tr("yellow"),
                              tr("green"), tr("blue"), tr("indigo"),
                              tr("violet"), tr("black")};
for (int i = 0; i < colorStrings.size(); i++)
    m_colorCombobox->addItem(QIcon(), trColorStrings[i], QColor(colorStrings[i]));

auto sizeLabel = new QLabel(tr("Size: "), this);
m_sizeCombobox = new QComboBox(this);
for (auto size : { 2, 3, 4, 6, 8, 10, 12, 15 })
    m_sizeCombobox->addItem(QIcon(), QString::number(size), size);

auto labelVisibilityLabel = new QLabel(tr("Label Visibility: "), this);
m_labelVisibilityCheckbox = new QCheckBox(this);

auto customLabelLabel = new QLabel(tr("Custom Label: "), this);
m_customLabelLineEdit = new QLineEdit(this);
ポイント選択時のコントロールの入力
コントロールができたので、選択されたポイントの現在のコントロール値を設定するロジックを提供する必要があります。選択したポイントにカスタマイズがない場合、シリーズ全体の値が使用されることに注意してください。この場合、シリーズが青い点を表示するように設定されていれば、青い色の値がカラー・コンボボックスに表示されます。
線分をクリックすると、クリックされた点を調べ、前の点の選択を削除し、クリックされた点を選択する。これにより、選択されたポイントがチャート上に視覚的に表示され、選択されていることを示すためにポイントが大きくなります。現在選択されているポイントのインデックスとPointConfigurations は、後で使用するためにメンバ変数に保存されます。
PointConfigurations 、コンボボックスの値が検索される。そして、コンボボックスの現在のインデックスがそれに応じて設定される。同様に、チェックボックスとラインエディットについても、PointConfigurations から値が検索され、それに一致するようにコントロールが設定される。
QObject::connect(m_series, &QXYSeries::clicked, m_series, [&](const QPointF &point) {
    int index = m_series->points().indexOf(point.toPoint());
    if (index != -1) {
        m_series->deselectAllPoints();
        m_series->selectPoint(index);
        m_selectedPointIndex = index;
        m_selectedPointConfig = m_series->pointConfiguration(index);
        const QPointF selectedPoint(m_series->at(index));
        m_selectedPointIndexLineEdit->setText("(" + QString::number(selectedPoint.x()) + ", " +
                                              QString::number(selectedPoint.y()) + ")");
        PointConfigurations config = m_series->pointConfiguration(index);

        QVariant colorVar = config[QXYSeries::PointConfiguration::Color];
        QColor color = colorVar.isValid() ? colorVar.value<QColor>() : m_series->color();
        if (m_colorCombobox->findData(color) < 0)
            m_colorCombobox->addItem(color.name(), color);
        m_colorCombobox->setCurrentIndex(m_colorCombobox->findData(color));

        QVariant sizeVar = config[QXYSeries::PointConfiguration::Size];
        qreal size = sizeVar.isValid() ? sizeVar.toReal() : m_series->markerSize();
        if (m_sizeCombobox->findData(size) < 0)
            m_sizeCombobox->addItem(QString::number(size), size);
        m_sizeCombobox->setCurrentIndex(m_sizeCombobox->findData(size));

        QVariant labelVisibilityVar = config[QXYSeries::PointConfiguration::LabelVisibility];
        bool labelVisibility = labelVisibilityVar.isValid() ? labelVisibilityVar.toBool() :
                                                              m_series->pointLabelsVisible();
        m_labelVisibilityCheckbox->setChecked(labelVisibility);

        QVariant customLabelVar = config[QXYSeries::PointConfiguration::LabelFormat];
        QString customLabel = customLabelVar.isValid() ? customLabelVar.toString() : "";
        m_customLabelLineEdit->setText(customLabel);
    }
});
選択されたポイントを構成するロジックを提供する
これで、コントロールに現在のコンフィギュレーションが入力されたので、コントロールに何 かを実行させる必要があります。選択した設定で選択されたポイントを構成する作業を行うロジックに、コントロールの信号を接続します。コントロールに関連付けられたQXYSeries::PointConfiguration の値をm_selectedPointConfig PointConfigurations メンバ変数に設定し、QXYSeries::setPointConfiguration を呼び出すだけです。
QObject::connect(m_colorCombobox, &QComboBox::activated, m_series, [&](const int) {
    m_selectedPointConfig[QXYSeries::PointConfiguration::Color] = m_colorCombobox->currentData();
    m_series->setPointConfiguration(m_selectedPointIndex, m_selectedPointConfig);
});
QObject::connect(m_sizeCombobox, &QComboBox::activated, m_series, [&](const int) {
    m_selectedPointConfig[QXYSeries::PointConfiguration::Size] = m_sizeCombobox->currentData();
    m_series->setPointConfiguration(m_selectedPointIndex, m_selectedPointConfig);
});
QObject::connect(m_labelVisibilityCheckbox, &QAbstractButton::clicked, m_series, [&](const bool checked) {
    m_selectedPointConfig[QXYSeries::PointConfiguration::LabelVisibility] = checked;
    m_series->setPointConfiguration(m_selectedPointIndex, m_selectedPointConfig);
});
QObject::connect(m_customLabelLineEdit, &QLineEdit::editingFinished, m_series, [&]() {
    m_selectedPointConfig[QXYSeries::PointConfiguration::LabelFormat] = m_customLabelLineEdit->text();
    m_series->setPointConfiguration(m_selectedPointIndex, m_selectedPointConfig);
});
チャートの作成とコントロールの配置
最後に、チャートとそのビューを作成し、系列をチャートに追加し、ウィンドウのレイアウトを作成します。その一環として、geometryChanged シグナルに接続し、チャートが最初に描画されたときのシグナルをキャッチする。これは、最初に選択されたポイントの正しい値を取得するためである。これを先に行うと、ポイントの値が不正確になります。この接続は、最初にこのシグナルが発生すると切断されます。
auto chart = new QChart;
chart->addSeries(m_series);
chart->createDefaultAxes();
chart->setTitle("Select points with mouse click");
chart->layout()->setContentsMargins(0, 0, 0, 0);
chart->legend()->setVisible(false);

m_selectInitialPointConnection = QObject::connect(chart, &QChart::geometryChanged, chart, [&]() {
    m_series->selectPoint(4);
    m_series->clicked(m_series->at(m_series->selectedPoints()[0]));
    disconnect(m_selectInitialPointConnection);
});

auto chartView = new QChartView(chart, this);
chartView->setRenderHint(QPainter::Antialiasing);

auto controlWidget = new QWidget(this);
auto controlLayout = new QGridLayout(controlWidget);
controlLayout->setColumnStretch(1, 1);

controlLayout->addWidget(selectedPointIndexLabel, 0, 0);
controlLayout->addWidget(m_selectedPointIndexLineEdit, 0, 1);

controlLayout->addWidget(colorLabel, 1, 0);
controlLayout->addWidget(m_colorCombobox, 1, 1);

controlLayout->addWidget(sizeLabel, 2, 0);
controlLayout->addWidget(m_sizeCombobox, 2, 1);

controlLayout->addWidget(labelVisibilityLabel, 3, 0);
controlLayout->addWidget(m_labelVisibilityCheckbox, 3, 1, 1, 2);

controlLayout->addWidget(customLabelLabel, 4, 0);
controlLayout->addWidget(m_customLabelLineEdit, 4, 1);

auto mainLayout = new QHBoxLayout(this);
mainLayout->addWidget(chartView);
mainLayout->setStretch(0, 1);
mainLayout->addWidget(controlWidget);
これで、個々のチャート・ポイントをカスタマイズする方法を示す、完全に機能するアプリケーションができました。
© 2025 The Qt Company Ltd. Documentation contributions included herein are the copyrights of their respective owners. The documentation provided herein is licensed under the terms of the GNU Free Documentation License version 1.3 as published by the Free Software Foundation. Qt and respective logos are trademarks of The Qt Company Ltd. in Finland and/or other countries worldwide. All other trademarks are property of their respective owners.

