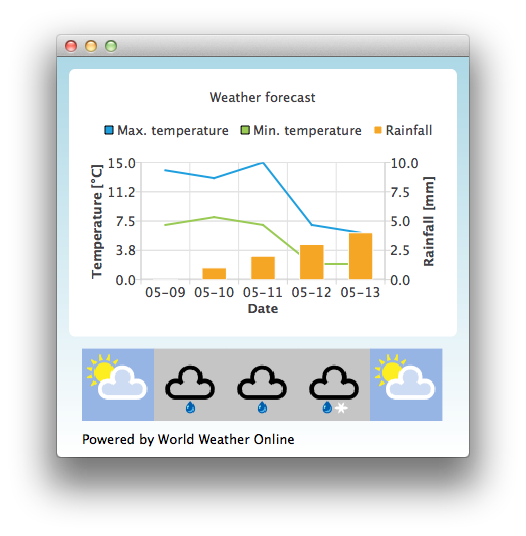
Qml 天気
これはqmlを使った様々なチャート・タイプの使い方を示す基本的なデモンストレーションです。

デフォルトでは、天気予報を模倣するために静的なテストデータを使用しています。http://www.worldweatheronline.com/ からアプリケーションIDを取得し、World Weather Onlineが提供する天気APIにアクセスすることもできます。そして、Qml Weather実行ファイルのパラメータとしてアプリケーションIDを与えることで、ライブデータを使用することができます。
例えば
bin\qmlweather.exe 1234567890abcdef123456
例の実行
から例を実行するには Qt Creatorからサンプルを実行するには、Welcome モードを開き、Examples からサンプルを選択します。詳しくはQt Creator: Tutorial を参照してください:ビルドと実行。
Qt Quick アプリケーションでのチャートの使用
このアプリケーション例では、ChartView といくつかの系列を使用して気象データを視覚化しています:
ChartView {
    id: chartView
    title: "Weather forecast"
    BarCategoryAxis {
        id: barCategoriesAxis
        titleText: "Date"
    }

    ValueAxis{
        id: valueAxisY2
        min: 0
        max: 10
        titleText: "Rainfall [mm]"
    }

    ValueAxis {
        id: valueAxisX
        // Hide the value axis; it is only used to map the line series to bar categories axis
        visible: false
        min: 0
        max: 5
    }

    ValueAxis{
        id: valueAxisY
        min: 0
        max: 15
        titleText: "Temperature [°C]"
    }

    LineSeries {
        id: maxTempSeries
        axisX: valueAxisX
        axisY: valueAxisY
        name: "Max. temperature"
    }

    LineSeries {
        id: minTempSeries
        axisX: valueAxisX
        axisY: valueAxisY
        name: "Min. temperature"
    }

    BarSeries {
        id: myBarSeries
        axisX: barCategoriesAxis
        axisYRight: valueAxisY2
        BarSet {
            id: rainfallSet
            label: "Rainfall"
        }
    }
天気予報データを取得するために、World Weather OnlineにHTTP GETリクエストを行う。JSONデータ形式で応答を要求する。
// Make HTTP GET request and parse the result
var xhr = new XMLHttpRequest;
xhr.open("GET",
         "http://free.worldweatheronline.com/feed/weather.ashx?q=Jyv%c3%a4skyl%c3%a4,Finland&format=json&num_of_days=5&key="
         + weatherAppKey);
xhr.onreadystatechange = function() {
    if (xhr.readyState == XMLHttpRequest.DONE) {
        var a = JSON.parse(xhr.responseText);
        parseWeatherData(a);
    }
}
xhr.send();
JSONレスポンスには予報データの配列が含まれている:
// Loop through the parsed JSON
for (var i in weatherData.data.weather) {
    var weatherObj = weatherData.data.weather[i];
この配列は、シリーズの入力データとして使用され、天気アイコンURLのコンテナとしてListModelが使用されます:
// Store temperature values, rainfall and weather icon.
// The temperature values begin from 0.5 instead of 0.0 to make the start from the
// middle of the rainfall bars. This makes the temperature lines visually better
// synchronized with the rainfall bars.
maxTempSeries.append(Number(i) + 0.5, weatherObj.tempMaxC);
minTempSeries.append(Number(i) + 0.5, weatherObj.tempMinC);
rainfallSet.append(weatherObj.precipMM);
weatherImageModel.append({"imageSource":weatherObj.weatherIconUrl[0].value});
© 2025 The Qt Company Ltd. Documentation contributions included herein are the copyrights of their respective owners. The documentation provided herein is licensed under the terms of the GNU Free Documentation License version 1.3 as published by the Free Software Foundation. Qt and respective logos are trademarks of The Qt Company Ltd. in Finland and/or other countries worldwide. All other trademarks are property of their respective owners.

