LineSeries QML Type
データを折れ線グラフで表示する。詳細...
| Import Statement: | import QtCharts 2.11 |
| In C++: | QLineSeries |
| Inherits: |
プロパティ
詳細説明
折れ線グラフは、直線で結ばれた一連のデータ点として情報を表示するために使われます。
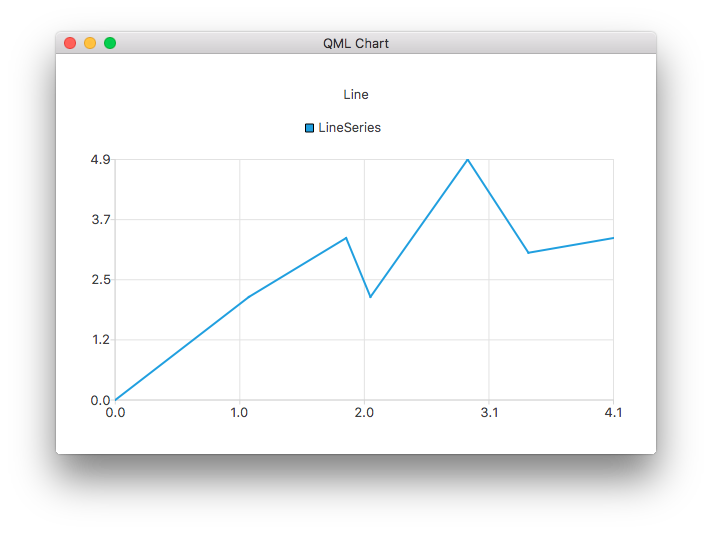
以下のQMLの例では、簡単な折れ線グラフの作成方法を示しています:
ChartView {
    title: "Line Chart"
    anchors.fill: parent
    antialiasing: true

    LineSeries {
        name: "Line"
        XYPoint { x: 0; y: 0 }
        XYPoint { x: 1.1; y: 2.1 }
        XYPoint { x: 1.9; y: 3.3 }
        XYPoint { x: 2.1; y: 2.1 }
        XYPoint { x: 2.9; y: 4.9 }
        XYPoint { x: 3.4; y: 3.0 }
        XYPoint { x: 4.1; y: 3.3 }
    }
}
プロパティの説明
capStyle : Qt::PenCapStyle
線のキャップスタイルを制御します。Qt.FlatCap,Qt.SquareCap,Qt.RoundCap のいずれかに設定します。 デフォルトでは、キャップスタイルは Qt.SquareCap です。
Qt::PenCapStyleも参照してください 。
count : int
シリーズのデータポイント数。
style : Qt::PenStyle
行のスタイルを制御する。Qt.NoPen,Qt.SolidLine,Qt.DashLine,Qt.DotLine,Qt.DashDotLine,Qt.DashDotDotLine のいずれかに設定します。 QML API ではQt.CustomDashLine の使用はサポートされていません。デフォルトでは、スタイルは Qt.SolidLine です。
Qt::PenStyleも参照してください 。
width : real
線の幅。デフォルトでは2.0。
© 2026 The Qt Company Ltd. Documentation contributions included herein are the copyrights of their respective owners. The documentation provided herein is licensed under the terms of the GNU Free Documentation License version 1.3 as published by the Free Software Foundation. Qt and respective logos are trademarks of The Qt Company Ltd. in Finland and/or other countries worldwide. All other trademarks are property of their respective owners.
