CustomSeries QML Type
CustomSeries 유형을 사용하면 사용자 지정 그래프 유형을 표시할 수 있습니다. 더 보기...
| Import Statement: | import QtGraphs |
| Since: | Qt 6.11 |
| In C++: | QCustomSeries |
속성
- delegate : Component
방법
- void append()
- void append(var data)
- void clear()
- void insert(int index)
- void insert(int index, var data)
- real mapX(real x)
- real mapY(real y)
- void remove(int index)
자세한 설명
커스텀시리즈를 사용하여 사용자 지정 그래프를 만들 수 있습니다. 각 요소에 대한 사용자 지정 데이터에 액세스할 수 있는 분산형 그래프라고 생각하면 됩니다.
CustomSeries는 그래프에 추가된 모든 항목을 렌더링하는 데 사용되는 델리게이트를 정의합니다. 각 항목에는 QVariantMap 에 저장된 사용자 정의 데이터가 포함되며 그래프에 있는 항목의 인덱스도 데이터 맵에 자동으로 추가됩니다. QML 컨텍스트에서 변형 맵은 JavaScript 객체로 정의됩니다. 시리즈는 이 맵을 델리게이트를 기반으로 생성된 각 요소에 전달합니다. 델리게이트는 데이터 사용 방법을 결정합니다.
데이터를 GraphsView 축에 정의된 렌더링 좌표에 매핑하려면 mapX 및 mapY 함수를 사용합니다.
참고: 현재 사용자 지정 시리즈의 개별 요소는 서로 정보를 공유하지 않습니다. 따라서 사용자 정의 선 시리즈를 구현할 수 없습니다.
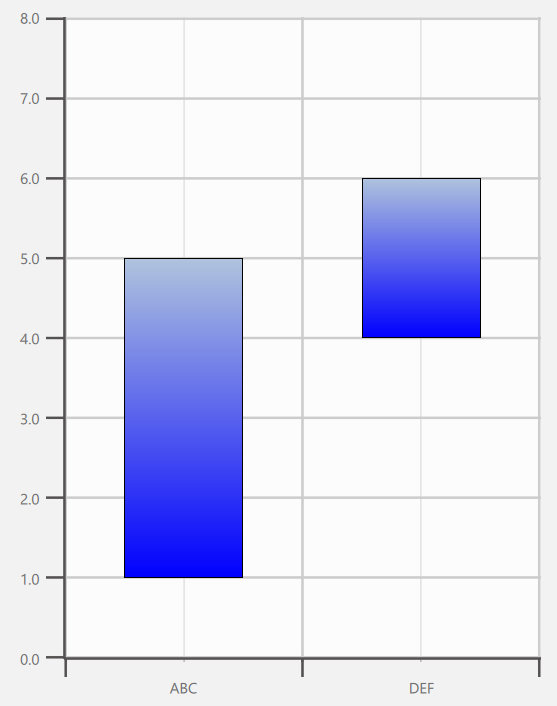
다음 코드는 표시된 사용자 지정 그래프를 구현합니다. 이 경우 사용자 지정 데이터에는 상한값과 하한값의 두 가지 값이 포함됩니다. 그런 다음 델리게이트에 정의되어 요소의 높이와 y 좌표에 영향을 줍니다.
import QtQuick
import QtGraphs

Window {
    width: 640
    height: 480
    visible: true

    GraphsView {
        anchors.fill: parent

        axisX: BarCategoryAxis {
            categories: ["ABC", "DEF"]
        }

        axisY: ValueAxis {
            max: 8
            tickInterval: 1
        }

        CustomSeries {
            id: custom

            delegate: Rectangle {
                property var data
                gradient: Gradient {
                    GradientStop { position: 0.0; color: "lightsteelblue" }
                    GradientStop { position: 1.0; color: "blue" }
                }
                border.width: 1
                x: custom.mapX(data.index + 0.5) - width * 0.5
                y: custom.mapY((data.upper + data.lower) * 0.5) - height * 0.5
                width: Math.abs(custom.mapX(1) - custom.mapX(0)) * 0.5
                height: Math.abs(custom.mapY(data.upper) - custom.mapY(data.lower))
            }

            CustomSeriesData {
                data: ({
                    upper: 5,
                    lower: 1
                })
            }

            CustomSeriesData {
                data: ({
                    upper: 6,
                    lower: 4
                })
            }
        }
    }
}
속성 문서
delegate : Component
델리게이트는 제공된 사용자 지정 데이터에 해당하는 요소를 QML에 삽입하는 데 사용됩니다. 데이터는 CustomSeries 자체에 정의되며 "data" 속성을 통해 위임된 요소에 제공됩니다.
delegate: Rectangle {
        property var data
        Rectangle {
            color: "tan"
            border.color: "black"
            border.width: 4
            y: series.mapY(data.index + 1) - height / 2 + 1
            x: series.mapX(data.median) - width / 2
            height: 32
            width: Math.abs(series.mapX(data.upperQuartile) - series.mapX(data.lowerQuartile))
        }
    }
}
메서드 문서
void append()
빈 데이터 항목을 시리즈에 추가합니다.
void append(var data)
data 에 정의된 데이터 항목을 시리즈에 추가합니다.
void clear()
모든 데이터 항목을 지웁니다.
void insert(int index)
index 위치에 빈 데이터 항목을 시리즈에 추가합니다.
void insert(int index, var data)
data 에 정의된 데이터 항목을 index 위치의 시리즈에 추가합니다.
real mapX(real x)
x 축-공간 좌표를 렌더링 공간으로 변환하여 반환합니다.
real mapY(real y)
y 축-공간 좌표를 렌더링 공간으로 변환하여 반환합니다.
void remove(int index)
위치 index 에서 데이터 항목을 제거합니다.
© 2026 The Qt Company Ltd. Documentation contributions included herein are the copyrights of their respective owners. The documentation provided herein is licensed under the terms of the GNU Free Documentation License version 1.3 as published by the Free Software Foundation. Qt and respective logos are trademarks of The Qt Company Ltd. in Finland and/or other countries worldwide. All other trademarks are property of their respective owners.
