GraphsView QML Type
모든 Qt Graphs 보기의 기본 유형입니다. 더 보기...
| Import Statement: | import QtGraphs |
- 상속된 멤버를 포함한 모든 멤버 목록
- GraphsView는 Qt Graphs 2D용 QML 유형의 일부입니다.
속성
- axisX : AbstractAxis
- axisXSmoothing : real
- axisY : AbstractAxis
- axisYSmoothing : real
- clipPlotArea : bool
(since 6.10) - gridSmoothing : real
- marginBottom : real
- marginLeft : real
- marginRight : real
- marginTop : real
- orientation : Qt.Orientation
- panStyle : enumeration
- plotArea : rect
(since 6.9) - seriesList : list
- shadowBarWidth : real
- shadowColor : color
- shadowSmoothing : real
- shadowVisible : bool
- shadowXOffset : real
- shadowYOffset : real
- theme : GraphsTheme
- zoomAreaDelegate : Component
- zoomAreaEnabled : bool
- zoomSensitivity : real
- zoomStyle : enumeration
방법
- void addSeries(AbstractSeries series)
- bool hasSeries(AbstractSeries series)
- void insertSeries(int index, AbstractSeries series)
- void removeSeries(AbstractSeries series)
- void removeSeries(int index)
자세한 설명
이 클래스는 시리즈와 테마를 함께 수집하여 그래프를 그립니다. 이 유형을 사용하려면 Qt Graphs 모듈을 가져와야 합니다:
import QtGraphs그런 다음 qml 파일에서 그래프 보기를 사용할 수 있습니다:
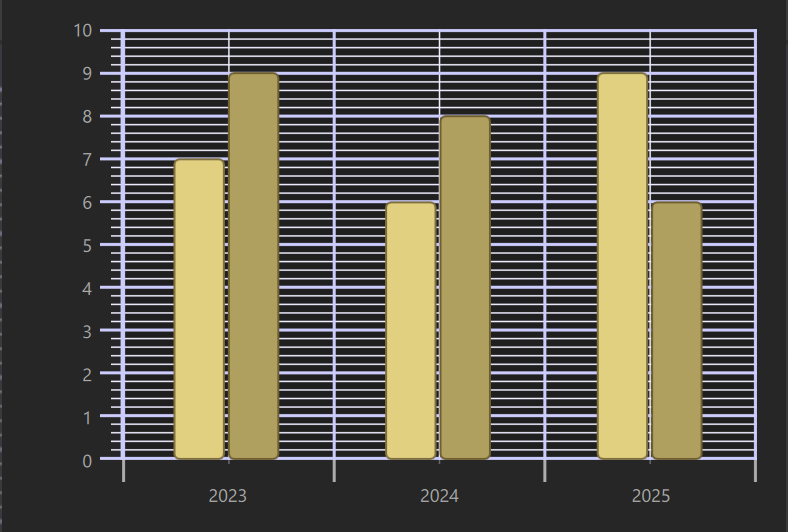
import QtQuick
import QtGraphs

GraphsView {
    anchors.fill: parent
    theme: GraphsTheme {
        colorScheme: GraphsTheme.ColorScheme.Dark
        seriesColors: ["#E0D080", "#B0A060"]
        borderColors: ["#807040", "#706030"]
        grid.mainColor: "#ccccff"
        grid.subColor: "#eeeeff"
        axisY.mainColor: "#ccccff"
        axisY.subColor: "#eeeeff"
    }
    axisX: BarCategoryAxis {
        categories: ["2023", "2024", "2025"]
        lineVisible: false
    }
    axisY: ValueAxis {
        min: 0
        max: 10
        subTickCount: 4
    }
    BarSeries {
        BarSet {
            values: [7, 6, 9]
        }
        BarSet {
            values: [9, 8, 6]
        }
    }
}
BarSeries, LineSeries, BarCategoryAxis, ValueAxis, GraphsTheme 를참조하세요 .
속성 문서
axisX : AbstractAxis
이 뷰 내부의 시리즈에 사용되는 x축입니다.
참고: 여러 그래프 뷰에 동일한 축을 설정하는 것은 지원되지 않습니다.
axisY 을참조하십시오 .
axisXSmoothing : real
그래프 X축 평활화(앤티앨리어싱) 양을 제어합니다. 기본적으로 스무딩은 1.0 입니다.
axisY : AbstractAxis
이 뷰 내부의 시리즈에 사용되는 Y축입니다.
참고: 여러 그래프 뷰에 동일한 축을 설정하는 것은 지원되지 않습니다.
axisX 을참조하십시오 .
axisYSmoothing : real
그래프 Y축 평활화(앤티앨리어싱) 양을 제어합니다. 기본적으로 스무딩은 1.0 입니다.
clipPlotArea : bool [since 6.10]
그래프 항목이 플롯 영역을 벗어날 경우 잘라낼지 여부를 제어합니다. 기본값은 true 입니다.
이 프로퍼티는 Qt 6.10에 도입되었습니다.
plotArea 를참조하십시오 .
gridSmoothing : real
그래프 그리드 평활화(앤티앨리어싱) 양을 제어합니다. 기본적으로 스무딩은 1.0 입니다.
marginBottom : real
그래프 하단의 빈 공간의 양입니다. 기본적으로 여백은 20입니다.
marginLeft : real
그래프 왼쪽에 있는 빈 공간의 양입니다. 기본적으로 여백은 20입니다.
marginRight : real
그래프 오른쪽에 있는 빈 공간의 양입니다. 기본적으로 여백은 20입니다.
marginTop : real
그래프 상단의 빈 공간의 양입니다. 기본적으로 여백은 20입니다.
orientation : Qt.Orientation
GraphsView 의 방향을 결정합니다. 방향이 Qt.Horizontal 인 경우 axisX 및 axisY 은 axisX 이 세로로, axisY 이 가로로 렌더링되도록 위치를 전환합니다. 이 속성은 현재 BarSeries 에서 사용되며 기본값은 Qt.Vertical 입니다.
panStyle : enumeration
GraphsView 의 패닝 스타일을 결정합니다. 패닝은 ValueAxis 의 패닝 속성을 조작하여 작동합니다. 기본값은 GraphsView.PanStyle.None 입니다.
| Constant | 설명 |
|---|---|
GraphsView.PanStyle.None | 이동이 비활성화됩니다. |
GraphsView.PanStyle.Drag | 마우스와 터치 드래그로 뷰를 이동합니다. |
plotArea : rect [read-only, since 6.9]
그래프가 그려지는 사각형입니다. 축 영역과 여백을 뺀 GraphsView 영역입니다.
이 프로퍼티는 Qt 6.9에 도입되었습니다.
marginTop, marginBottom, marginLeft, marginRight 을참조하세요 .
seriesList : list [read-only]
GraphsView 에 의해 렌더링되는 시리즈 목록. GraphsView 의 시리즈 유형 하위 요소로 자동으로 채워집니다.
이 속성이 기본값이므로 하위 요소가 시리즈 목록에 자동으로 추가됩니다.
BarSeries, LineSeries, ScatterSeries 를참조하세요 .
shadowBarWidth : real
그래프 그리드 그림자 너비를 제어합니다. 기본적으로 그림자 너비는 2.0 로 설정되어 있습니다.
shadowColor : color
그래프 그리드 그림자 색을 제어합니다. 기본적으로 그림자 색상은 black 으로 설정되어 있습니다.
shadowSmoothing : real
그래프 그리드 그림자 평활화(앤티앨리어싱) 양을 제어합니다. 기본적으로 그림자 평활화는 4.0 로 설정되어 있습니다.
shadowVisible : bool
그래프 그리드 그림자 표시 여부를 제어합니다. 기본적으로 그림자 표시 여부는 false 로 설정됩니다.
shadowXOffset : real
그래프 그리드 그림자 X 오프셋을 제어합니다. 기본적으로 그림자 X 오프셋은 0.0 으로 설정되어 있습니다.
shadowYOffset : real
그래프 그리드 그림자 Y 오프셋을 제어합니다. 기본적으로 그림자 Y 오프셋은 0.0 으로 설정되어 있습니다.
theme : GraphsTheme
그래프에 사용되는 테마입니다. 색상, 축선, 글꼴 등을 결정합니다. 테마를 설정하지 않은 경우 기본 테마가 사용됩니다.
zoomAreaDelegate : Component
사용자가 드래그 동작을 수행하여 영역을 확대할 때 그려지는 QML 요소를 결정합니다.
zoomAreaEnabled : bool
확대/축소 영역은 마우스 및 터치 드래그를 통해 zoomAreaDelegate 에 의해 결정된 상자를 그리도록 변경됩니다. 그래프를 놓으면 ValueAxis 확대/축소 및 이동 속성이 변경되어 뷰가 그려진 상자와 교차하는 영역만 포함하도록 합니다.
zoomAreaDelegate도 참조하세요 .
zoomSensitivity : real
확대/축소하는 동안 줌 값이 얼마나 빨리 변경되는지 결정합니다.
zoomStyle : enumeration
GraphsView 의 확대/축소 스타일을 결정합니다. ValueAxis 확대/축소 속성을 조작하여 확대/축소가 작동합니다. 기본값은 GraphsView.ZoomStyle.None 입니다.
| 상수 | 설명 |
|---|---|
GraphsView.ZoomStyle.None | 확대/축소가 비활성화됩니다. |
GraphsView.ZoomStyle.Center | 핀치 줌 및 마우스 휠 줌은 그래프 보기의 중앙을 향해 확대/축소합니다. |
메서드 문서
void addSeries(AbstractSeries series)
GraphsView 에 series 을 추가합니다. series 이 null이면 추가되지 않습니다. series 이 이미 그래프에 속해 있으면 끝으로 이동합니다.
bool hasSeries(AbstractSeries series)
series 이 그래프에 있으면 true 을 반환합니다.
void insertSeries(int index, AbstractSeries series)
index 으로 지정한 위치에 series 을 삽입합니다. series 이 null이면 삽입되지 않습니다. series 이 이미 그래프에 속해 있으면 index 으로 이동합니다.
void removeSeries(AbstractSeries series)
그래프에서 series 을 제거합니다.
void removeSeries(int index)
그래프에서 index 으로 지정된 계열을 제거합니다.
© 2026 The Qt Company Ltd. Documentation contributions included herein are the copyrights of their respective owners. The documentation provided herein is licensed under the terms of the GNU Free Documentation License version 1.3 as published by the Free Software Foundation. Qt and respective logos are trademarks of The Qt Company Ltd. in Finland and/or other countries worldwide. All other trademarks are property of their respective owners.
