2D 그래프 Qt Widgets
위젯 기반 애플리케이션에서 2D용 그래프 사용하기.
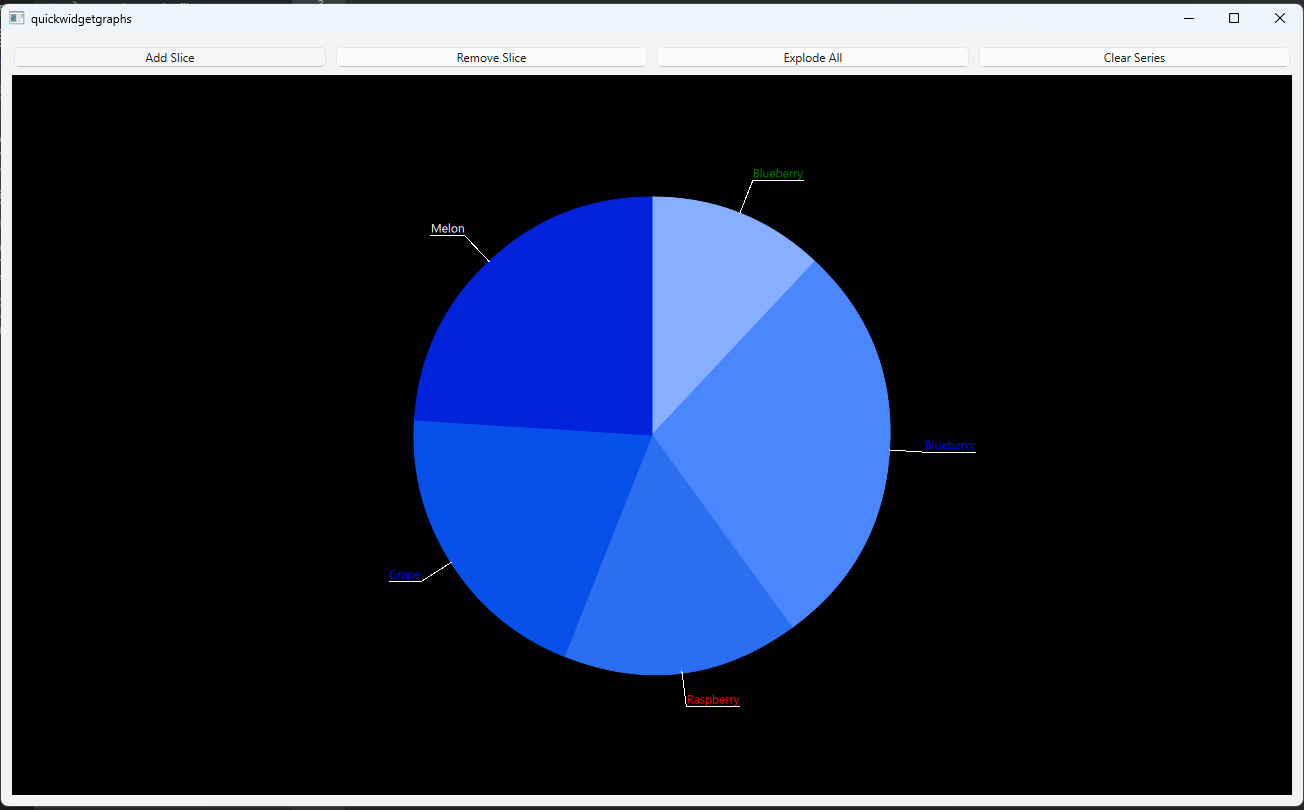
그래프 2D는 Qt Quick 애플리케이션만 지원합니다. 이 예는 QQuickWidget 을 사용하여 Qt Widgets 애플리케이션에서 간단한 2D 파이 그래프를 표시하는 방법을 보여줍니다.
예제 실행하기
에서 예제를 실행하려면 Qt Creator에서 Welcome 모드를 열고 Examples 에서 예제를 선택합니다. 자세한 내용은 Qt Creator: 튜토리얼을 참조하세요 : 빌드 및 실행을 참조하세요.
메인 뷰
PieWidget클래스는 데모 애플리케이션의 메인 보기를 구현합니다.PieWidget클래스에서 애플리케이션 레이아웃 및 UI 요소를 구현하는 데 사용되는 위젯을 인스턴스화합니다.m_quickWidget = new QQuickWidget; m_widget = new QWidget; m_vLayout = new QVBoxLayout(m_widget); m_hLayout = new QHBoxLayout; ...
PieGraph클래스는 슬라이스를 추가 및 제거하기 위한 로직을 처리하고 다른 기능을 수행하는 데 사용됩니다.m_pieGraph = new PieGraph; ...
- 버튼을 초기화하여 레이아웃에 추가합니다.
void PieWidget::initializeButtons()
{
    QPushButton *addButton = new QPushButton("Add Slice");
    QPushButton *removeButton = new QPushButton("Remove Slice");
    QPushButton *explodeButton = new QPushButton("Explode All");
    QPushButton *clearButton = new QPushButton("Clear Series");

    m_hLayout->addWidget(addButton);
    m_hLayout->addWidget(removeButton);
    m_hLayout->addWidget(explodeButton);
    m_hLayout->addWidget(clearButton);

    QObject::connect(addButton, &QPushButton::clicked, m_pieGraph, &PieGraph::onAddSlice);
    QObject::connect(removeButton, &QPushButton::clicked, m_pieGraph, &PieGraph::onRemoveSlice);
    QObject::connect(explodeButton, &QPushButton::clicked, m_pieGraph, &PieGraph::onExplode);
    QObject::connect(clearButton, &QPushButton::clicked, m_pieGraph, &PieGraph::onClearSeries);
}
그래프 데이터 조작하기
PieGraph 클래스는 이 예제에서 그래프 데이터를 조작하기 위한 모든 로직을 구현합니다.
PieGraph클래스에서pieSeries프로퍼티를 선언합니다.... Q_PROPERTY(QPieSeries *pieSeries READ pieSeries WRITE setPieSeries NOTIFY pieSeriesChanged FINAL) ...
- 슬라이스를 추가, 제거, 분해하고 파이 시리즈를 지우는 함수를 만듭니다.
...
public:
...
    void appendSlice();
    void removeSlice();
    void explodeSlices();
    void clearSeries();
    void fillSliceInfo();
public Q_SLOTS:
    void onAddSlice();
    void onRemoveSlice();
    void onExplode();
    void onClearSeries();
...
- 파이 계열을 인스턴스화하고 생성자에서 여러 슬라이스를 추가합니다.
...
m_pieSeries = new QPieSeries;

fillSliceInfo();

for (int i = 1; i < 5; ++i) {
    QPieSlice *slice = new QPieSlice;
    slice->setValue(m_sliceInfo.value.at(QRandomGenerator::global()->bounded(0, 6)));
    slice->setLabel(m_sliceInfo.label.at(QRandomGenerator::global()->bounded(0, 6)));
    slice->setLabelColor(m_sliceInfo.color.at(QRandomGenerator::global()->bounded(0, 6)));
    m_pieSeries->append(slice);
}
m_pieSeries->setLabelsVisible(true);
...
appendSlice함수는 QPieSlice 를 생성하고 일부 속성을 설정한 다음 파이 시리즈에 추가합니다.레이블 가시성을
true으로 설정했더라도 나중에 파이 시리즈에 추가된 슬라이스에서는 작동하지 않습니다. 추가되는 모든 슬라이스에 대해 생성 시 가시성을true으로 설정해야 합니다.QPieSlice *slice = new QPieSlice; slice->setValue(m_sliceInfo.value.at(QRandomGenerator::global()->bounded(0, 6))); slice->setLabel(m_sliceInfo.label.at(QRandomGenerator::global()->bounded(0, 6))); slice->setLabelColor(m_sliceInfo.color.at(QRandomGenerator::global()->bounded(0, 6))); slice->setLabelVisible(true); m_pieSeries->append(slice);
removeSlice함수에서 QPieSeries::remove()를 호출합니다.explodeSlices함수에서 모든 슬라이스를 반복하고 현재 상태에 따라 QPieSlice::setExploded()을true또는false로 설정합니다.clearSeries함수에서 QPieSeries::clear()를 호출합니다. 이렇게 하면 파이 시리즈에서 모든 슬라이스가 삭제됩니다. 이 함수는 파이 시리즈 자체를 삭제하지 않는다는 점에 유의하세요.
그래프 뷰 초기화하기
GraphsView 테마를 사용자 지정하려면 사용자 지정 QGraphsTheme 을 만듭니다.
auto theme = new QGraphsTheme(m_quickWidget);
theme->setTheme(QGraphsTheme::Theme::BlueSeries);
theme->setLabelBorderVisible(true);
theme->setLabelBackgroundVisible(true);
theme->setBackgroundColor(Qt::black);
QQuickWidget::loadFromModule()를 사용하여 GraphsView 을 로드합니다. QGraphsTheme 및 QPieSeries 을 QQuickWidget::setInitialProperties()에 전달하여 theme 및 seriesList 속성을 초기화합니다.
m_quickWidget->setResizeMode(QQuickWidget::SizeRootObjectToView);
m_quickWidget->resize(1280, 720);
m_quickWidget->setInitialProperties({
    {"theme", QVariant::fromValue(theme) },
    {"seriesList", QVariant::fromValue(m_pieGraph->pieSeries()) }
});
m_quickWidget->loadFromModule("QtGraphs", "GraphsView");
© 2026 The Qt Company Ltd. Documentation contributions included herein are the copyrights of their respective owners. The documentation provided herein is licensed under the terms of the GNU Free Documentation License version 1.3 as published by the Free Software Foundation. Qt and respective logos are trademarks of The Qt Company Ltd. in Finland and/or other countries worldwide. All other trademarks are property of their respective owners.
