QDateTimeAxis Class
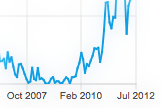
QDateTimeAxis 类可在图表坐标轴上添加日期和时间。更多
| Header: | #include <QDateTimeAxis> |
| In QML: | DateTimeAxis |
| Inherits: | QAbstractAxis |
属性
公共函数
| QDateTimeAxis(QObject *parent = nullptr) | |
| virtual | ~QDateTimeAxis() |
| QString | format() const |
| QDateTime | max() const |
| QDateTime | min() const |
| void | setFormat(QString format) |
| void | setMax(QDateTime max) |
| void | setMin(QDateTime min) |
| void | setRange(QDateTime min, QDateTime max) |
| void | setTickCount(int count) |
| int | tickCount() const |
重新实现的公共函数
| virtual QAbstractAxis::AxisType | type() const override |
信号
| void | formatChanged(QString format) |
| void | maxChanged(QDateTime max) |
| void | minChanged(QDateTime min) |
| void | rangeChanged(QDateTime min, QDateTime max) |
| void | tickCountChanged(int tickCount) |
详细说明
QDateTimeAxis 可设置为显示带有刻度线、网格线和阴影的轴线。可以通过设置适当的日期时间格式来配置标签。QDateTimeAxis 可正确显示公元前 4714 年至公元 287396 年的日期。有关QDateTime 的其他限制,请参阅QDateTime 文档。
注意: 在将 qreal 定义为 float 的平台上,QDateTimeAxis 将被禁用。

QDateTimeAxis 可与任何QXYSeries 一起使用。要在系列中添加数据点,需要使用QDateTime::toMSecsSinceEpoch() :
QLineSeries *series = new QLineSeries;

QDateTime xValue;
xValue.setDate(QDate(2012, 1 , 18));
xValue.setTime(QTime(9, 34));
qreal yValue = 12;
series->append(xValue.toMSecsSinceEpoch(), yValue);

xValue.setDate(QDate(2013, 5 , 11));
xValue.setTime(QTime(11, 14));
qreal yValue = 22;
series->append(xValue.toMSecsSinceEpoch(), yValue);
以下代码片段说明了如何将系列添加到图表并设置 QDateTimeAxis:
QChartView *chartView = new QChartView;
chartView->chart()->addSeries(series);

// ...
QDateTimeAxis *axisX = new QDateTimeAxis;
axisX->setFormat("dd-MM-yyyy h:mm");
chartView->chart()->setAxisX(axisX, series);
属性文档
format : QString
该属性保存格式字符串,用于从QDateTime 对象中创建轴标签。
有关如何定义字符串的信息,请参见QDateTime 文档。
访问功能:
| QString | format() const |
| void | setFormat(QString format) |
通知信号:
| void | formatChanged(QString format) |
另请参见 QChart::locale 。
max : QDateTime
该属性用于保存坐标轴上的最大值。
设置该属性时,如有必要,会对最小值进行调整,以确保范围保持有效。
访问功能:
| QDateTime | max() const |
| void | setMax(QDateTime max) |
通知信号:
| void | maxChanged(QDateTime max) |
min : QDateTime
该属性用于保存坐标轴上的最小值。
设置该属性时,必要时会调整最大值,以确保范围保持有效。
访问功能:
| QDateTime | min() const |
| void | setMin(QDateTime min) |
通知信号:
| void | minChanged(QDateTime min) |
tickCount : int
该属性用于保存坐标轴上刻度线的数量。
访问功能
| int | tickCount() const |
| void | setTickCount(int count) |
Notifier 信号:
| void | tickCountChanged(int tickCount) |
成员函数 文档
[explicit] QDateTimeAxis::QDateTimeAxis(QObject *parent = nullptr)
构造一个轴对象,它是parent 的子对象。
[virtual noexcept] QDateTimeAxis::~QDateTimeAxis()
销毁对象。
[signal] void QDateTimeAxis::formatChanged(QString format)
当format 的轴发生变化时会发出该信号。
注: 属性format 的通知信号。
[signal] void QDateTimeAxis::maxChanged(QDateTime max)
当max 指定的轴的最大值发生变化时,将发出该信号。
注: 属性max 的通知信号。
[signal] void QDateTimeAxis::minChanged(QDateTime min)
当min 指定的坐标轴最小值发生变化时,将发出该信号。
注: 属性min 的通知信号。
[signal] void QDateTimeAxis::rangeChanged(QDateTime min, QDateTime max)
当min 和max 指定的轴的最小值或最大值发生变化时,将发出该信号。
void QDateTimeAxis::setRange(QDateTime min, QDateTime max)
设置坐标轴上从min 到max 的范围。如果min 大于max ,则此函数返回,不做任何更改。
void QDateTimeAxis::setTickCount(int count)
将坐标轴上的刻度线数量设置为count 。
注: 属性tickCount 的设置函数。
另请参阅 tickCount() 。
int QDateTimeAxis::tickCount() const
返回坐标轴上刻度线的数量。
注: 属性 tickCount 的获取函数。
另请参阅 setTickCount().
[signal] void QDateTimeAxis::tickCountChanged(int tickCount)
当tickCount 指定的坐标轴上的刻度线数量发生变化时,将发出该信号。
注: 属性tickCount 的通知信号。
[override virtual] QAbstractAxis::AxisType QDateTimeAxis::type() const
重实现:QAbstractAxis::type() 常量。
返回轴的类型。
© 2025 The Qt Company Ltd. Documentation contributions included herein are the copyrights of their respective owners. The documentation provided herein is licensed under the terms of the GNU Free Documentation License version 1.3 as published by the Free Software Foundation. Qt and respective logos are trademarks of The Qt Company Ltd. in Finland and/or other countries worldwide. All other trademarks are property of their respective owners.

