Qt Charts
Qt Charts 模块提供了一组易于使用的图表组件。它使用 Qt Graphics View Framework 将图表与现代用户界面集成在一起。Qt Charts 可用作 QWidgets、QGraphicsWidget 或 QML 类型。用户可通过选择其中一个主题轻松创建令人印象深刻的图表。
注: 自 Qt 6.10 起,Qt Charts 模块已被弃用。对于新项目,请使用 Qt Graphs模块。Qt Graphs 使用各平台的本地渲染后端(macOS 上使用 Metal,Windows 上使用 DirectX,Linux 上使用 OpenGL 或 Vulkan)来实现 2D 和 3D 图形的硬件加速渲染。Qt Graphs 使用 Qt Quick Shapes用于 2D 图形渲染,而不是Qt Charts 模块使用的过时的 Qt Graphics View Framework。要从Qt Charts 移植到Qt Graphs 模块,请参阅Qt Graphs 从Qt Charts 移植。
Qt Charts QML API 是在 QML 应用程序中显示图表的直观而简单的方法。
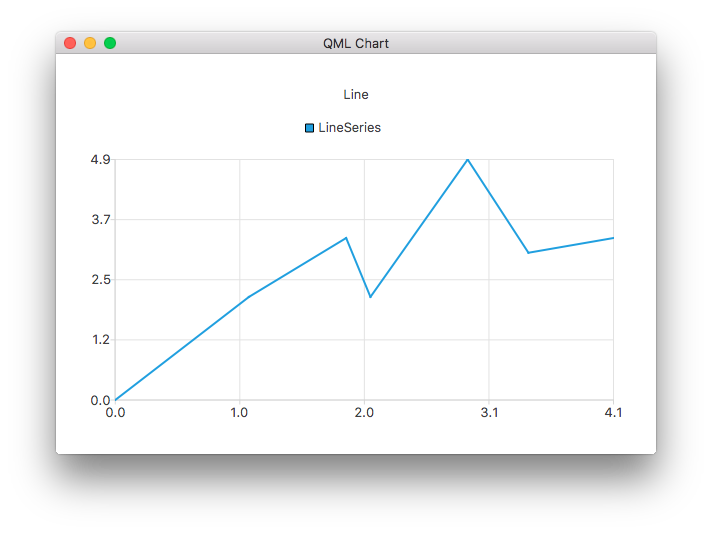
本例展示了如何创建一个简单的折线图:

ChartView {
    title: "Line Chart"
    anchors.fill: parent
    antialiasing: true

    LineSeries {
        name: "Line"
        XYPoint { x: 0; y: 0 }
        XYPoint { x: 1.1; y: 2.1 }
        XYPoint { x: 1.9; y: 3.3 }
        XYPoint { x: 2.1; y: 2.1 }
        XYPoint { x: 2.9; y: 4.9 }
        XYPoint { x: 3.4; y: 3.0 }
        XYPoint { x: 4.1; y: 3.3 }
    }
}
使用模块
QML API
模块的 QML 类型可通过QtCharts 导入。要使用这些类型,请在 .qml 文件中添加以下导入语句:
import QtCharts
注意: QML 类型需要QApplication 的实例,因为该模块依赖 Qt 的图形视图框架(Graphics View Framework)进行渲染。QGuiApplication 是不够的。不过,使用Qt Creator 的Qt Quick Application 向导创建的项目基于Qt Quick 模板,默认使用QGuiApplication 。此类项目中的所有QGuiApplication 实例都必须替换为QApplication 。
C++ 应用程序接口
使用 Qt 模块的 C++ API 需要直接或通过其他依赖关系与模块库链接。一些编译工具对此提供了专门支持,包括CMake和qmake。
使用 CMake 构建
使用find_package() 命令在Qt6 软件包中找到所需的模块组件:
find_package(Qt6 REQUIRED COMPONENTS Charts)
target_link_libraries(mytarget PRIVATE Qt6::Charts)更多详情,请参阅使用 CMake 构建概述。
使用 qmake 构建
要配置模块以便用 qmake 构建,可在项目的 .pro 文件中添加模块作为QT 变量的值:
QT += charts
模块演变
Qt Charts 的变更列出了模块 API 和功能方面的重要变更,这些变更是为 Qt 6 系列的 Qt 所做的。
文章和指南
示例
API 参考
许可证
Qt Charts Qt 是由The Qt Company 根据商业许可提供的。此外,它还受GNU 通用公共许可证第 3 版的保护。有关详细信息,请参阅Qt Licensing。
© 2025 The Qt Company Ltd. Documentation contributions included herein are the copyrights of their respective owners. The documentation provided herein is licensed under the terms of the GNU Free Documentation License version 1.3 as published by the Free Software Foundation. Qt and respective logos are trademarks of The Qt Company Ltd. in Finland and/or other countries worldwide. All other trademarks are property of their respective owners.

