ScatterSeries QML Type
ScatterSeries 类型在散点图中显示数据。更多
| Import Statement: | import QtGraphs |
| In C++: | QScatterSeries |
| Inherits: |
- 所有成员(包括继承成员)列表
- ScatterSeries 是Qt Graphs QML Types for 2D 的一部分。
属性
- pointDelegate : Component
详细说明
散点数据以点集合的形式显示在图表上。为每个点指定两个值,以确定其在横轴和纵轴上的位置。
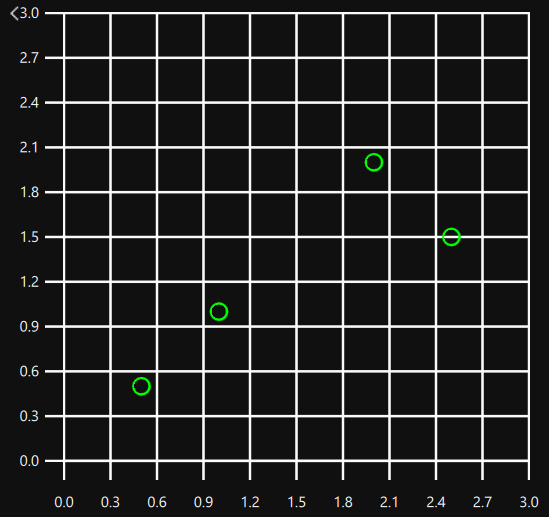
您可以通过在GraphsView 中创建 ScatterSeries 来表示散点数据。通过创建 XYPoints 作为 ScatterSeries 的子代,定义每个点的 x 和 y 值,可将数据添加到图形中。
GraphsView {
    anchors.fill: parent
    axisX: ValueAxis {
        max: 3
    }
    axisY: ValueAxis {
        max: 3
    }

    ScatterSeries {
        color: "#00ff00"
        XYPoint { x: 0.5; y: 0.5 }
        XYPoint { x: 1; y: 1 }
        XYPoint { x: 2; y: 2 }
        XYPoint { x: 2.5; y: 1.5 }
    }
}
通过添加多个 ScatterSeries 作为GraphsView 的子代,可以创建多个散点图。在这种情况下,只有一个系列可以定义所使用的坐标轴,因为多个定义只能覆盖前面的定义。
GraphsView {
    anchors.fill: parent
    ScatterSeries {
        color: "#00ff00"
        axisX: ValueAxis {
            max: 3
        }
        axisY: ValueAxis {
            max: 3
        }

        XYPoint { x: 0.5; y: 0.5 }
        XYPoint { x: 1; y: 1 }
        XYPoint { x: 2; y: 2 }
        XYPoint { x: 2.5; y: 1.5 }
    }

    ScatterSeries {
        color: "#ff0000"
        XYPoint { x: 0.5; y: 3 }
        XYPoint { x: 1; y: 2 }
        XYPoint { x: 2; y: 2.5 }
        XYPoint { x: 2.5; y: 1 }
    }
}
属性文档
pointDelegate : Component
用给定的 QML 组件标记点。
pointDelegate: Image {
    source: "images/happy_box.png"
}
© 2026 The Qt Company Ltd. Documentation contributions included herein are the copyrights of their respective owners. The documentation provided herein is licensed under the terms of the GNU Free Documentation License version 1.3 as published by the Free Software Foundation. Qt and respective logos are trademarks of The Qt Company Ltd. in Finland and/or other countries worldwide. All other trademarks are property of their respective owners.
