GraphsView QML Type
所有Qt Graphs 视图的基本类型。更多
| Import Statement: | import QtGraphs |
- 所有成员的列表,包括继承成员
- GraphsView 是Qt Graphs QML Types for 2D 的一部分。
属性
- axisX : AbstractAxis
- axisXSmoothing : real
- axisY : AbstractAxis
- axisYSmoothing : real
- clipPlotArea : bool
(since 6.10) - gridSmoothing : real
- marginBottom : real
- marginLeft : real
- marginRight : real
- marginTop : real
- orientation : Qt.Orientation
- panStyle : enumeration
- plotArea : rect
(since 6.9) - seriesList : list
- shadowBarWidth : real
- shadowColor : color
- shadowSmoothing : real
- shadowVisible : bool
- shadowXOffset : real
- shadowYOffset : real
- theme : GraphsTheme
- zoomAreaDelegate : Component
- zoomAreaEnabled : bool
- zoomSensitivity : real
- zoomStyle : enumeration
方法
- void addSeries(AbstractSeries series)
- bool hasSeries(AbstractSeries series)
- void insertSeries(int index, AbstractSeries series)
- void removeSeries(AbstractSeries series)
- void removeSeries(int index)
详细描述
该类将序列和主题收集在一起并绘制图表。您需要导入Qt Graphs 模块才能使用该类型:
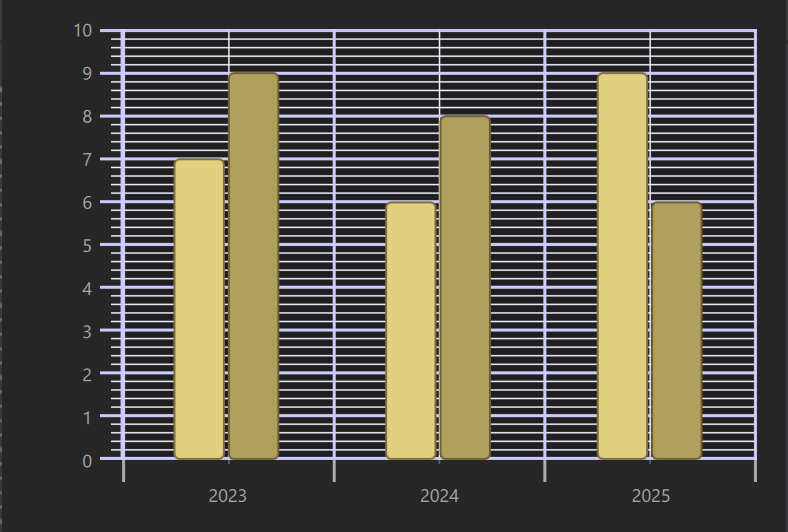
import QtGraphs之后,您就可以在 qml 文件中使用 GraphsView:
import QtQuick
import QtGraphs

GraphsView {
    anchors.fill: parent
    theme: GraphsTheme {
        colorScheme: GraphsTheme.ColorScheme.Dark
        seriesColors: ["#E0D080", "#B0A060"]
        borderColors: ["#807040", "#706030"]
        grid.mainColor: "#ccccff"
        grid.subColor: "#eeeeff"
        axisY.mainColor: "#ccccff"
        axisY.subColor: "#eeeeff"
    }
    axisX: BarCategoryAxis {
        categories: ["2023", "2024", "2025"]
        lineVisible: false
    }
    axisY: ValueAxis {
        min: 0
        max: 10
        subTickCount: 4
    }
    BarSeries {
        BarSet {
            values: [7, 6, 9]
        }
        BarSet {
            values: [9, 8, 6]
        }
    }
}
另请参见 BarSeries,LineSeries,BarCategoryAxis,ValueAxis 和GraphsTheme 。
属性文档
axisX : AbstractAxis
该视图中系列使用的 x 轴。
注意: 不支持在多个图形视图中设置相同的轴。
另请参阅 axisY 。
axisXSmoothing : real
控制图形 X 轴平滑(抗锯齿)量。默认情况下,平滑值为1.0 。
axisY : AbstractAxis
该视图中系列使用的 y 轴。
注意: 不支持在多个图形视图中设置相同的轴。
另请参阅 axisX 。
axisYSmoothing : real
控制图形 Y 轴平滑(抗锯齿)量。默认情况下,平滑值为1.0 。
clipPlotArea : bool [since 6.10]
控制图形项在超出绘图区域时是否应被剪切。默认值为true 。
此属性在 Qt 6.10 中引入。
另请参阅 plotArea 。
gridSmoothing : real
控制图形网格平滑(抗锯齿)量。默认情况下,平滑度为1.0 。
marginBottom : real
图表底部的空白量。默认情况下,边距为 20。
marginLeft : real
图表左侧的空白量。默认情况下,边距为 20。
marginRight : real
图表右侧的空白量。默认情况下,边距为 20。
marginTop : real
图表顶部的空白量。默认情况下,边距为 20。
orientation : Qt.Orientation
确定GraphsView 的方向。当方向为Qt.Horizontal 时,axisX 和axisY 将切换位置,使axisX 垂直渲染,axisY 水平渲染。该属性目前由BarSeries 使用。默认值为Qt.Vertical 。
panStyle : enumeration
确定GraphsView 的平移样式。平移通过操作ValueAxis 的平移属性来实现。默认值为GraphsView.PanStyle.None 。
| 常数 | 说明 |
|---|---|
GraphsView.PanStyle.None | 平移被禁用。 |
GraphsView.PanStyle.Drag | 鼠标和触摸拖动可左右平移视图。 |
plotArea : rect [read-only, since 6.9]
绘制图形的矩形区域。这是GraphsView 区域减去坐标轴区域和边距。
此属性在 Qt 6.9 中引入。
另请参阅 marginTop,marginBottom,marginLeft, 和marginRight 。
seriesList : list [read-only]
由GraphsView 呈现的系列列表。由GraphsView 的系列类型子元素自动填充。
这是默认属性,因此子元素会自动添加到系列列表中。
另请参阅 BarSeries,LineSeries, 和ScatterSeries 。
shadowBarWidth : real
控制图形网格阴影宽度。默认情况下,阴影宽度设置为2.0 。
shadowColor : color
控制图形网格阴影颜色。默认情况下,阴影颜色设置为black 。
shadowSmoothing : real
控制图形网格阴影平滑(抗锯齿)量。默认情况下,阴影平滑设置为4.0 。
shadowVisible : bool
控制图形网格阴影是否可见。默认情况下,阴影可见性设置为false 。
shadowXOffset : real
控制图形网格阴影 X 偏移量。默认情况下,阴影 X 偏移量设置为0.0 。
shadowYOffset : real
控制图形网格阴影 Y 偏移量。默认情况下,阴影 Y 偏移量设置为0.0 。
theme : GraphsTheme
图表使用的主题。决定着色、轴线、字体等。如果未设置主题,则使用默认主题。
zoomAreaDelegate : Component
确定当用户执行拖动动作放大某一区域时绘制的 QML 元素。
zoomAreaEnabled : bool
缩放区域改变鼠标和触摸拖动,绘制一个由zoomAreaDelegate 确定的方框。释放后,图形ValueAxis 的缩放和平移属性将发生变化,使视图仅覆盖所画框的交叉区域。
另请参阅 zoomAreaDelegate 。
zoomSensitivity : real
决定缩放时缩放值的变化速度。
zoomStyle : enumeration
确定GraphsView 的缩放样式。通过操作ValueAxis 缩放属性实现缩放。默认值为GraphsView.ZoomStyle.None 。
| 常数 | 说明 |
|---|---|
GraphsView.ZoomStyle.None | 禁用缩放。 |
GraphsView.ZoomStyle.Center | 捏合缩放和鼠标滚轮缩放都是向图表视图的中心缩放。 |
方法文档
void addSeries(AbstractSeries series)
将series 追加到GraphsView 中。如果series 为空,则不会添加。如果series 已经属于图表,则会被移到最后。
bool hasSeries(AbstractSeries series)
如果series 在图形中,则返回true 。
void insertSeries(int index, AbstractSeries series)
在index 指定的位置插入series 。如果series 为空,则不会插入。如果series 已经属于图形,则会被移到index 中。
void removeSeries(AbstractSeries series)
从图表中删除series 。
void removeSeries(int index)
从图表中删除index 指定的序列。
© 2026 The Qt Company Ltd. Documentation contributions included herein are the copyrights of their respective owners. The documentation provided herein is licensed under the terms of the GNU Free Documentation License version 1.3 as published by the Free Software Foundation. Qt and respective logos are trademarks of The Qt Company Ltd. in Finland and/or other countries worldwide. All other trademarks are property of their respective owners.
