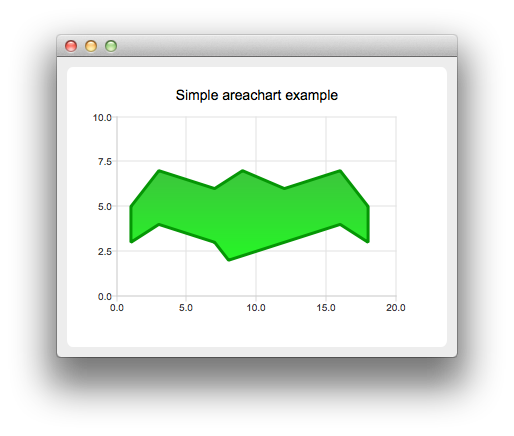
创建区域图表
注: 这是 "带 Widgets 图库的图表"示例的一部分。

要创建区域图表,我们需要两个QLineSeries 实例。它们将定义区域的上下边界。
auto series0 = new QLineSeries;
auto series1 = new QLineSeries;
我们为两个序列添加数据并使用流运算符。
*series0 << QPointF(1, 5) << QPointF(3, 7) << QPointF(7, 6) << QPointF(9, 7) << QPointF(12, 6)
         << QPointF(16, 7) << QPointF(18, 5);
*series1 << QPointF(1, 3) << QPointF(3, 4) << QPointF(7, 3) << QPointF(8, 2) << QPointF(12, 3)
         << QPointF(16, 4) << QPointF(18, 3);
现在,我们使用两个线性序列对象创建一个QAreaSeries 实例。我们设置自定义渐变填充和轮廓宽度。
auto series = new QAreaSeries(series0, series1);
series->setName("Batman");
QPen pen(0x059605);
pen.setWidth(3);
series->setPen(pen);

QLinearGradient gradient(QPointF(0, 0), QPointF(0, 1));
gradient.setColorAt(0.0, 0x3cc63c);
gradient.setColorAt(1.0, 0x26f626);
gradient.setCoordinateMode(QGradient::ObjectBoundingMode);
series->setBrush(gradient);
最后,我们创建QChartView 实例,设置标题、抗锯齿并添加区域系列。我们还创建了默认坐标轴,并指定了坐标轴上的范围。
auto chart = new QChart;
chart->addSeries(series);
chart->setTitle("Simple Area Chart");
chart->createDefaultAxes();
chart->axes(Qt::Horizontal).first()->setRange(0, 20);
chart->axes(Qt::Vertical).first()->setRange(0, 10);
图表就可以显示了。
createDefaultChartView(chart);
© 2025 The Qt Company Ltd. Documentation contributions included herein are the copyrights of their respective owners. The documentation provided herein is licensed under the terms of the GNU Free Documentation License version 1.3 as published by the Free Software Foundation. Qt and respective logos are trademarks of The Qt Company Ltd. in Finland and/or other countries worldwide. All other trademarks are property of their respective owners.

