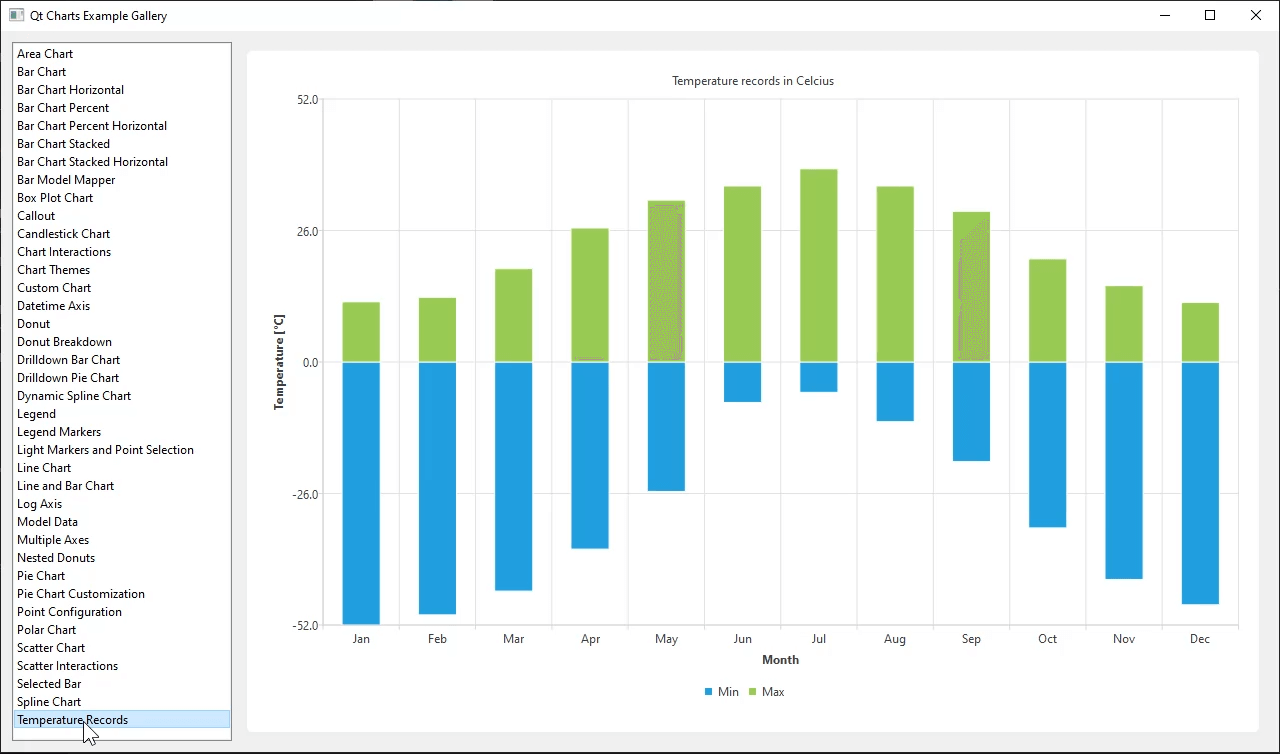
带 Widgets 图库的图表
演示Qt Charts Widgets API 的应用程序。

该示例通过使用附带的示例数据为用户填充多种图表类型和交互,演示了Qt Charts API 的部件功能。
演示如何使用条形图的选择功能。 | |
演示如何组合不同的图表并设置坐标轴。 | |
演示如何创建一个简单的区域图。 | |
条形图(BarChart)在类别中以单独的条形显示数据集。 | |
显示如何创建箱形图。 | |
显示如何创建蜡烛图 | |
展示不同内置主题的外观和感觉。 | |
演示如何创建水平条形图。 | |
展示如何创建简单的水平百分比柱形图。 | |
演示如何创建简单的堆叠水平柱形图。 | |
演示如何创建简单的折线图。 | |
演示如何使用 QPieSeries API 创建嵌套甜甜圈图表。 | |
演示如何创建简单的百分比柱形图 | |
演示如何创建具有多个不同序列的简单极坐标图 | |
该示例显示了如何创建简单的散点图。 | |
演示如何创建简单的堆叠条形图。 | |
演示如何创建甜甜圈分解图。 | |
演示如何自定义图表元素的外观。 | |
演示如何从图表中分离图例并将其连接回来。 | |
演示如何创建带负柱形的柱形图。 | |
演示如何在图表顶部绘制附加元素(呼出)。 | |
演示如何使用堆叠柱状图实现向下钻取。 | |
演示如何将 QLineChart 与 QDateTimeAxis 结合使用。 | |
演示如何修改单个点的配置。 | |
演示如何使用 QAbstractItemModel 派生模型作为条形图系列的数据。 | |
演示如何使用图例标记。 | |
演示如何为系列使用光标记和点选择。 | |
演示如何使用 QLogValueAxis。 | |
演示如何使用 QAbstractItemModel 派生模型作为系列数据。 | |
演示如何为每个系列创建一个带有垂直轴的图表。 |
运行示例
要从 Qt Creator,打开Welcome 模式,然后从Examples 中选择示例。有关详细信息,请参见Qt Creator: 教程:构建并运行。
如果你想用 QML 实现图表,请参阅Charts with QML Gallery。
© 2025 The Qt Company Ltd. Documentation contributions included herein are the copyrights of their respective owners. The documentation provided herein is licensed under the terms of the GNU Free Documentation License version 1.3 as published by the Free Software Foundation. Qt and respective logos are trademarks of The Qt Company Ltd. in Finland and/or other countries worldwide. All other trademarks are property of their respective owners.

