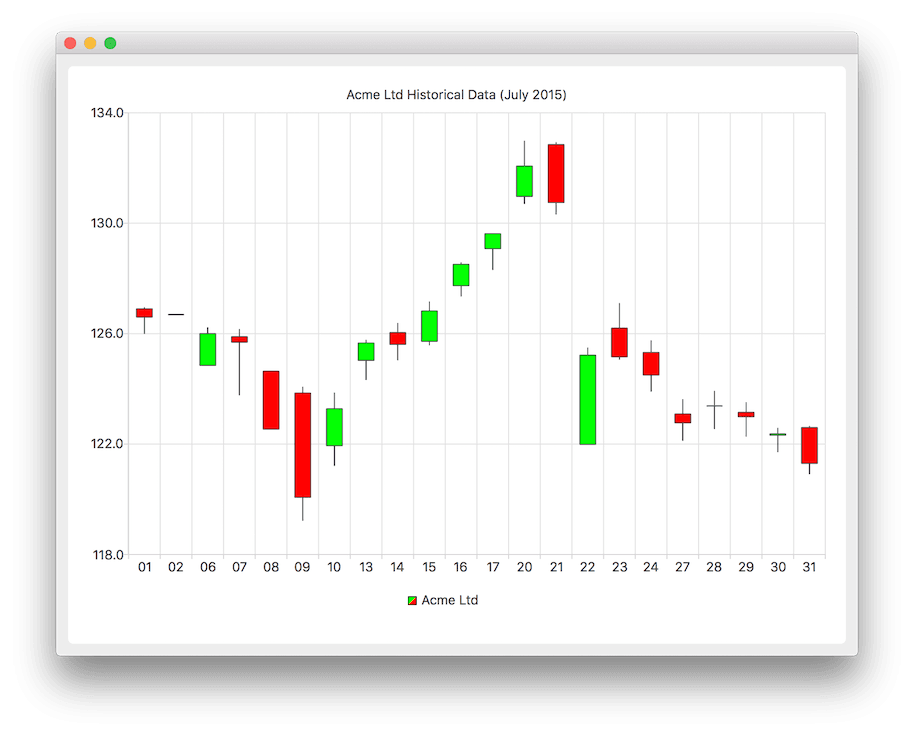
创建烛台图表
注: 这是 "带 Widgets 图库的图表"示例的一部分。

要显示蜡烛图,我们首先要创建QCandlestickSeries 来处理每日数据。我们还指定了自定义的递增和递减主体颜色。
auto acmeSeries = new QCandlestickSeries;
acmeSeries->setName("Acme Ltd");
acmeSeries->setIncreasingColor(QColor(Qt::green));
acmeSeries->setDecreasingColor(QColor(Qt::red));
QFile 该类用于访问保存非连续数据的文本文件。CandlestickDataReader 是一个辅助类,用于读取文本文件,并从数据中查找开盘价、最高价、最低价、收盘价和时间戳值。CandlestickDataReader 将在后面详细说明。readCandlestickSet() 方法读取这些值,并将其设置到QCandlestickSet 项中,该方法将返回给调用者。返回的QCandlestickSet 项被添加到系列中。我们还将保存自定义类别列表,以备日后使用。
QFile acmeData(":candlestick");
if (!acmeData.open(QIODevice::ReadOnly | QIODevice::Text)) {
    m_loadError = QStringLiteral("Failed to load '%1' file.").arg(acmeData.fileName());
    return false;
}

QStringList categories;

CandlestickDataReader dataReader(&acmeData);
while (!dataReader.atEnd()) {
    QCandlestickSet *set = dataReader.readCandlestickSet();
    if (set) {
        acmeSeries->append(set);
        categories << QDateTime::fromMSecsSinceEpoch(set->timestamp()).toString("dd");
    }
}
下面将创建一个新的QChart 实例,并将先前创建的系列对象添加到该实例中。我们还定义了标题,并将动画设置为QChart::SeriesAnimation 。
auto chart = new QChart;
chart->addSeries(acmeSeries);
chart->setTitle("Acme Ltd. Historical Data (July 2015)");
chart->setAnimationOptions(QChart::SeriesAnimations);
在此,我们要求图表为我们的演示创建默认坐标轴。然后,我们通过从图表中查询坐标轴指针,为水平坐标轴设置自定义类别,然后从先前保存的自定义类别列表中设置类别。我们还可以通过查询图表中坐标轴的指针,为垂直坐标轴设置范围,然后为该坐标轴设置最小值和最大值。
chart->createDefaultAxes();

auto axisX = qobject_cast<QBarCategoryAxis *>(chart->axes(Qt::Horizontal).at(0));
axisX->setCategories(categories);

auto axisY = qobject_cast<QValueAxis *>(chart->axes(Qt::Vertical).at(0));
axisY->setMax(axisY->max() * 1.01);
axisY->setMin(axisY->min() * 0.99);
下面,我们将图例设置为可见,并将其置于图表底部。
chart->legend()->setVisible(true);
chart->legend()->setAlignment(Qt::AlignBottom);
最后,我们将图表添加到视图中。
createDefaultChartView(chart);
图表就可以显示了。
这里将详细解释readCandlestickSet() 方法。首先,从文件中读取一行,拒绝以 # 开头的行,因为它们被视为注释行。
QString line = m_textStream.readLine();
if (line.startsWith("#") || line.isEmpty())
    return nullptr;
在文件中,数据以空格分隔的数字序列排列。在这个片段中,该行被分割成单个数字字符串,并存储在QStringList 中。
QStringList strList = line.split(QLatin1Char(' '), Qt::SkipEmptyParts);
if (strList.count() != 5)
    return nullptr;
要从连续数据中选择值,需要使用以下代码。strList 中的值按以下顺序存储:时间戳、开盘价、最高价、最低价、收盘价。
const qreal timestamp = strList.at(0).toDouble();
const qreal open = strList.at(1).toDouble();
const qreal high = strList.at(2).toDouble();
const qreal low = strList.at(3).toDouble();
const qreal close = strList.at(4).toDouble();
最后,以下代码片段展示了如何创建一个新的QCandlestickSet 并为其提供所有必要的值。
auto candlestickSet = new QCandlestickSet(timestamp);
candlestickSet->setOpen(open);
candlestickSet->setHigh(high);
candlestickSet->setLow(low);
candlestickSet->setClose(close);
© 2025 The Qt Company Ltd. Documentation contributions included herein are the copyrights of their respective owners. The documentation provided herein is licensed under the terms of the GNU Free Documentation License version 1.3 as published by the Free Software Foundation. Qt and respective logos are trademarks of The Qt Company Ltd. in Finland and/or other countries worldwide. All other trademarks are property of their respective owners.

