使用主题创建图表
注: 这是带 Widgets 图库的图表示例的一部分。
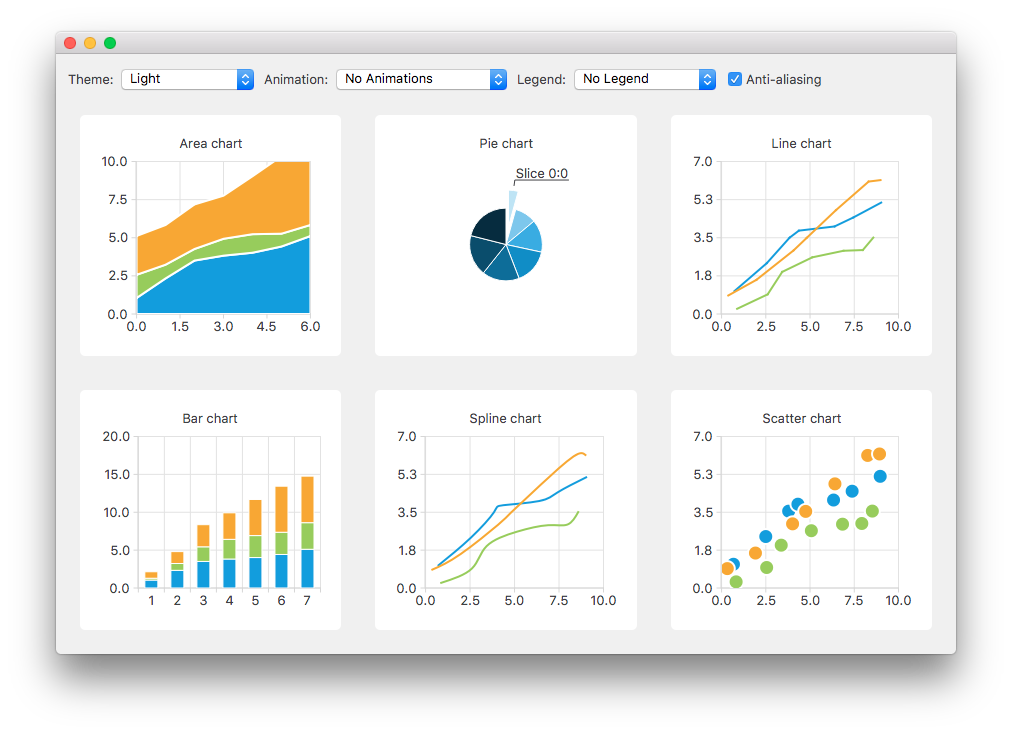
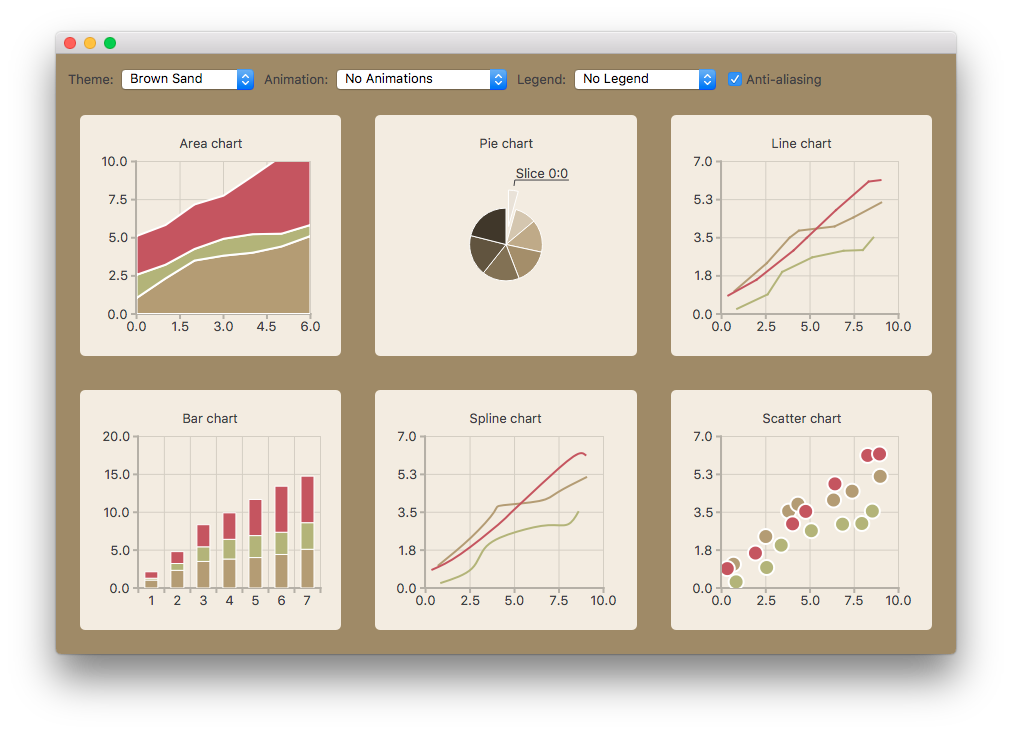
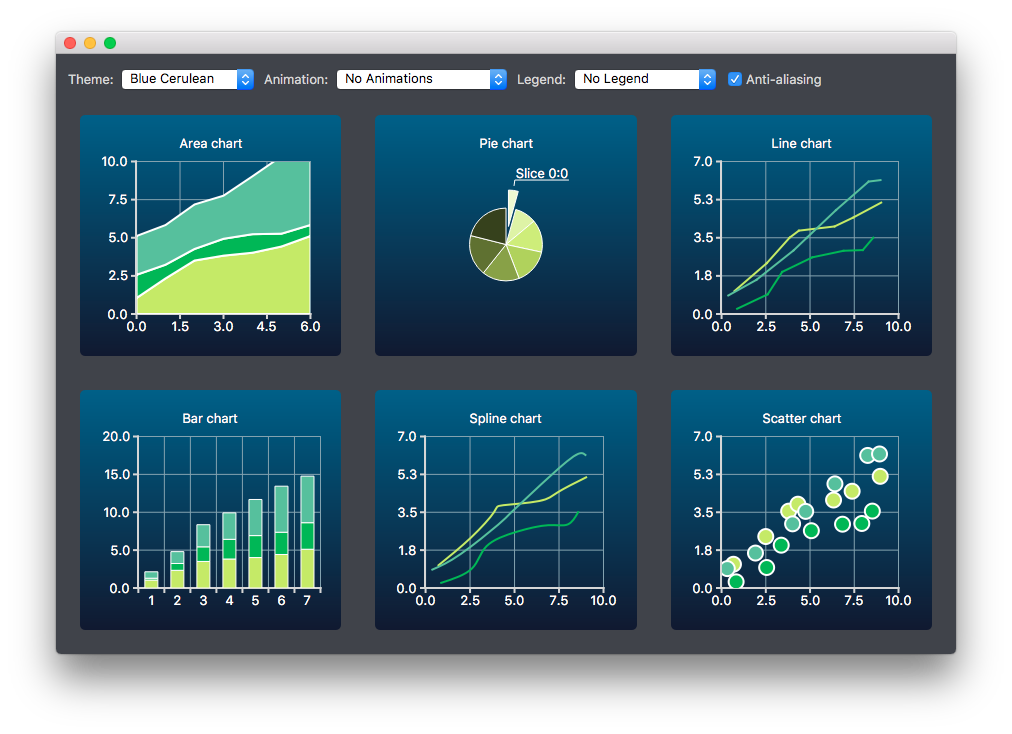
在这里,您可以为某些支持的图表类型更改不同内置主题的外观和感觉。


创建图表
不同类型的图表分别生成并添加到布局中。例如,折线图的创建过程如下。其他图表类型的创建也类似。
首先创建一个图表。
auto chart = new QChart;
chart->setTitle("Line Chart");
生成一组常用的随机数据并将其放入一个列表中。每个图表类型都会使用该列表为图表系列添加数据。对于折线系列,会创建QLineSeries 实例并添加到图表中。
QString name("Series ");
int nameIndex = 0;
for (const DataList &list : m_dataTable) {
    auto series = new QLineSeries(chart);
    for (const Data &data : list)
        series->append(data.first);
    series->setName(name + QString::number(nameIndex));
    nameIndex++;
    chart->addSeries(series);
}
为线性序列创建默认坐标轴。我们还根据系列所用数据的范围为坐标轴指定了范围。
chart->createDefaultAxes();
chart->axes(Qt::Horizontal).first()->setRange(0, m_valueMax);
chart->axes(Qt::Vertical).first()->setRange(0, m_valueCount);
我们还希望在标签和 Y 轴之间添加更多空间。为此,我们指定了一种标签格式,为标签添加空格字符。
// Add space to label to add space between labels and axis
auto axisY = qobject_cast<QValueAxis *>(chart->axes(Qt::Vertical).first());
Q_ASSERT(axisY);
axisY->setLabelFormat("%.1f  ");
最后,将折线图添加到网格布局中。
chartView = new QChartView(createLineChart(), this);
m_ui->gridLayout->addWidget(chartView, 1, 2);
更改主题
用户可以选择在示例中使用的内置主题。该主题将应用于布局中的所有图表。
auto theme = static_cast<QChart::ChartTheme>(
            m_ui->themeComboBox->itemData(m_ui->themeComboBox->currentIndex()).toInt());
    ...
chartView->chart()->setTheme(theme);
更改动画、图例和抗锯齿
在本示例中,还可以看到更改动画、图例和抗锯齿对图表外观的影响。
根据用户的选择,将在每个图表上设置所使用的动画类型。图表中可以没有动画,也可以为网格坐标轴或序列设置动画,或者两者都设置动画。
QChart::AnimationOptions options(
            m_ui->animatedComboBox->itemData(m_ui->animatedComboBox->currentIndex()).toInt());
if (!m_charts.isEmpty() && m_charts.at(0)->chart()->animationOptions() != options) {
    for (QChartView *chartView : charts)
        chartView->chart()->setAnimationOptions(options);
}
图表可以显示图例。图例可以对齐到图表的不同侧面。
Qt::Alignment alignment(
            m_ui->legendComboBox->itemData(m_ui->legendComboBox->currentIndex()).toInt());

if (!alignment) {
    for (QChartView *chartView : charts)
        chartView->chart()->legend()->hide();
} else {
    for (QChartView *chartView : charts) {
        chartView->chart()->legend()->setAlignment(alignment);
        chartView->chart()->legend()->show();
    }
}
用户还可以查看更改抗锯齿选项会如何改变图表的外观。抗锯齿会根据用户的选择进行更新。
bool checked = m_ui->antialiasCheckBox->isChecked();
for (QChartView *chart : charts)
    chart->setRenderHint(QPainter::Antialiasing, checked);
© 2025 The Qt Company Ltd. Documentation contributions included herein are the copyrights of their respective owners. The documentation provided herein is licensed under the terms of the GNU Free Documentation License version 1.3 as published by the Free Software Foundation. Qt and respective logos are trademarks of The Qt Company Ltd. in Finland and/or other countries worldwide. All other trademarks are property of their respective owners.

