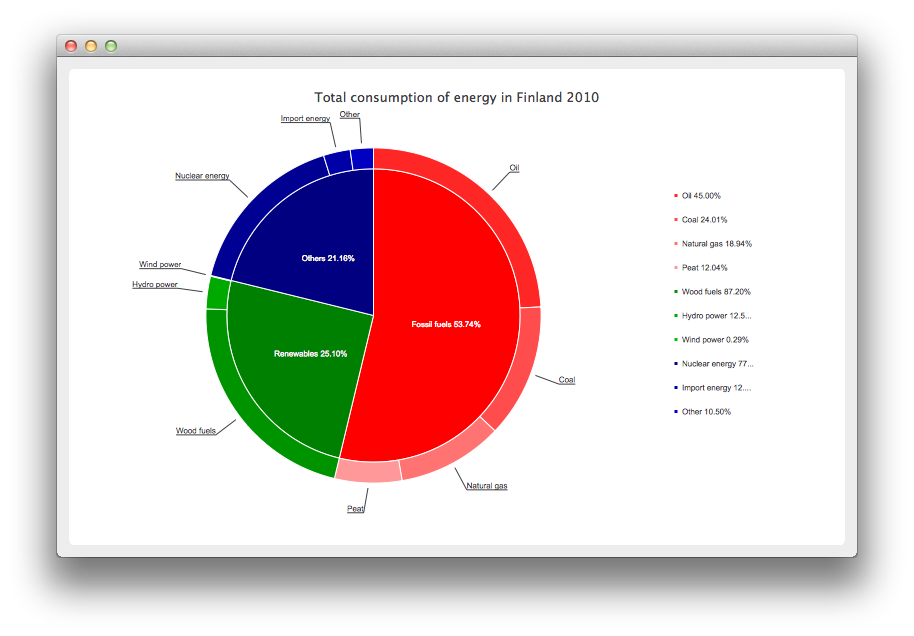
创建甜甜圈细分图表
注: 这是 "带 Widgets 图库的图表"示例的一部分。

创建甜甜圈细分图表
首先为图表定义一些数据。
// Graph is based on data of 'Total consumption of energy increased by 10 per cent in 2010'
// Statistics Finland, 13 December 2011
// http://www.stat.fi/til/ekul/2010/ekul_2010_2011-12-13_tie_001_en.html

auto series1 = new QPieSeries;
series1->setName("Fossil fuels");
series1->append("Oil", 353295);
series1->append("Coal", 188500);
series1->append("Natural gas", 148680);
series1->append("Peat", 94545);

auto series2 = new QPieSeries;
series2->setName("Renewables");
series2->append("Wood fuels", 319663);
series2->append("Hydro power", 45875);
series2->append("Wind power", 1060);

auto series3 = new QPieSeries;
series3->setName("Others");
series3->append("Nuclear energy", 238789);
series3->append("Import energy", 37802);
series3->append("Other", 32441);
然后创建一个图表,在其中添加数据。请注意,这是我们自己的图表,源自QChart 。
auto donutBreakdown = new DonutBreakdownChart;
donutBreakdown->setAnimationOptions(QChart::AllAnimations);
donutBreakdown->setTitle("Total consumption of energy in Finland 2010");
donutBreakdown->legend()->setAlignment(Qt::AlignRight);
donutBreakdown->addBreakdownSeries(series1, Qt::red);
donutBreakdown->addBreakdownSeries(series2, Qt::darkGreen);
donutBreakdown->addBreakdownSeries(series3, Qt::darkBlue);
我们自己的图表是这样工作的:我们在构造函数中创建一个主数列,该数列汇总了细分数列提供的数据。这就是中间的饼图。
DonutBreakdownChart::DonutBreakdownChart(QGraphicsItem *parent, Qt::WindowFlags wFlags)
    : QChart(QChart::ChartTypeCartesian, parent, wFlags)
{
    // create the series for main center pie
    m_mainSeries = new QPieSeries;
    m_mainSeries->setPieSize(0.7);
    QChart::addSeries(m_mainSeries);
}
添加细分系列后,数据将用于在主系列中创建一个片段,而细分系列本身将用于创建一个甜甜圈片段,使其与主系列中的相应片段对齐。
void DonutBreakdownChart::addBreakdownSeries(QPieSeries *breakdownSeries, QColor color)
{
    QFont font("Arial", 8);

    // add breakdown series as a slice to center pie
    auto mainSlice = new DonutBreakdownMainSlice(breakdownSeries);
    mainSlice->setName(breakdownSeries->name());
    mainSlice->setValue(breakdownSeries->sum());
    m_mainSeries->append(mainSlice);

    // customize the slice
    mainSlice->setBrush(color);
    mainSlice->setLabelVisible();
    mainSlice->setLabelColor(Qt::white);
    mainSlice->setLabelPosition(QPieSlice::LabelInsideHorizontal);
    mainSlice->setLabelFont(font);

    // position and customize the breakdown series
    breakdownSeries->setPieSize(0.8);
    breakdownSeries->setHoleSize(0.7);
    breakdownSeries->setLabelsVisible();
    const auto slices = breakdownSeries->slices();
    for (QPieSlice *slice : slices) {
        color = color.lighter(115);
        slice->setBrush(color);
        slice->setLabelFont(font);
    }

    // add the series to the chart
    QChart::addSeries(breakdownSeries);

    // recalculate breakdown donut segments
    recalculateAngles();

    // update customize legend markers
    updateLegendMarkers();
}
下面是甜甜圈片段的起始角和终止角的计算方法。
void DonutBreakdownChart::recalculateAngles()
{
    qreal angle = 0;
    const auto slices = m_mainSeries->slices();
    for (QPieSlice *slice : slices) {
        QPieSeries *breakdownSeries = qobject_cast<DonutBreakdownMainSlice *>(slice)->breakdownSeries();
        breakdownSeries->setPieStartAngle(angle);
        angle += slice->percentage() * 360.0; // full pie is 360.0
        breakdownSeries->setPieEndAngle(angle);
    }
}
图例标记是定制的,用于显示细分百分比。主层切片的标记是隐藏的。
void DonutBreakdownChart::updateLegendMarkers()
{
    // go through all markers
    const auto allseries = series();
    for (QAbstractSeries *series : allseries) {
        const auto markers = legend()->markers(series);
        for (QLegendMarker *marker : markers) {
            auto pieMarker = qobject_cast<QPieLegendMarker *>(marker);
            if (series == m_mainSeries) {
                // hide markers from main series
                pieMarker->setVisible(false);
            } else {
                // modify markers from breakdown series
                pieMarker->setLabel(QString("%1 %2%")
                                    .arg(pieMarker->slice()->label())
                                    .arg(pieMarker->slice()->percentage() * 100, 0, 'f', 2));
                pieMarker->setFont(QFont("Arial", 8));
            }
        }
    }
}
而主层切片则在标签上显示百分比。
DonutBreakdownMainSlice::DonutBreakdownMainSlice(QPieSeries *breakdownSeries, QObject *parent)
    : QPieSlice(parent),
      m_breakdownSeries(breakdownSeries)
{
    connect(this, &DonutBreakdownMainSlice::percentageChanged,
            this, &DonutBreakdownMainSlice::updateLabel);
}
    ...
void DonutBreakdownMainSlice::updateLabel()
{
    setLabel(QString("%1 %2%").arg(m_name).arg(percentage() * 100, 0, 'f', 2));
}
现在我们已经定义了图表,终于可以创建QChartView 并显示图表了。
createDefaultChartView(donutBreakdown);
© 2025 The Qt Company Ltd. Documentation contributions included herein are the copyrights of their respective owners. The documentation provided herein is licensed under the terms of the GNU Free Documentation License version 1.3 as published by the Free Software Foundation. Qt and respective logos are trademarks of The Qt Company Ltd. in Finland and/or other countries worldwide. All other trademarks are property of their respective owners.

