ChartView QML Type
管理图表系列、图例和坐标轴的图形表示。更多
| Import Statement: | import QtCharts 2.11 |
| Inherited By: |
属性
- animationDuration : int
- animationEasingCurve : easing
- animationOptions : enumeration
- axes : list<AbstractAxis>
- backgroundColor : color
- backgroundRoundness : real
- count : int
- dropShadowEnabled : bool
- legend : Legend
- locale : locale
(since QtCharts 2.0) - localizeNumbers : bool
(since QtCharts 2.0) - margins : Margins
- plotArea : rect
- plotAreaColor : color
- theme : enumeration
- title : string
- titleColor : color
- titleFont : font
信号
- seriesAdded(AbstractSeries series)
- seriesRemoved(AbstractSeries series)
方法
- Axis axisX(AbstractSeries series)
- Axis axisY(AbstractSeries series)
- AbstractSeries createSeries(enumeration type, string name, AbstractAxis axisX, AbstractAxis axisY)
- bool isZoomed()
- point mapToPosition(point value, AbstractSeries series)
- point mapToValue(point position, AbstractSeries series)
- void removeAllSeries()
- void removeSeries(AbstractSeries series)
- void scrollDown(real pixels)
- void scrollLeft(real pixels)
- void scrollRight(real pixels)
- void scrollUp(real pixels)
- AbstractSeries series(int index)
- AbstractSeries series(string name)
- void setAxisX(AbstractAxis axis, AbstractSeries series)
- void setAxisY(AbstractAxis axis, AbstractSeries series)
- void zoom(real factor)
- void zoomIn()
- void zoomIn(rect rectangle)
- void zoomOut()
- void zoomReset()
详细说明
ChartView 类型可将不同的系列类型显示为图表。
本示例演示如何创建一个简单的折线图:
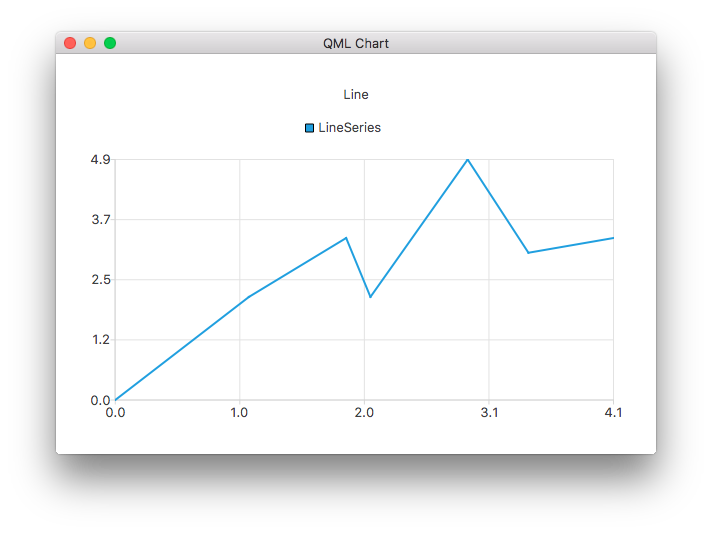
ChartView {
    title: "Line Chart"
    anchors.fill: parent
    antialiasing: true

    LineSeries {
        name: "Line"
        XYPoint { x: 0; y: 0 }
        XYPoint { x: 1.1; y: 2.1 }
        XYPoint { x: 1.9; y: 3.3 }
        XYPoint { x: 2.1; y: 2.1 }
        XYPoint { x: 2.9; y: 4.9 }
        XYPoint { x: 3.4; y: 3.0 }
        XYPoint { x: 4.1; y: 3.3 }
    }
}
属性文档
animationDuration : int
图表动画的持续时间。
animationEasingCurve : easing
图表动画的缓和曲线。
animationOptions : enumeration
图表中启用的动画:
| 常量 | 说明 |
|---|---|
ChartView.NoAnimation | 图表中禁用的动画。这是默认值。 |
ChartView.GridAxisAnimations | 图表中已启用网格轴动画。 |
ChartView.SeriesAnimations | 图表中已启用系列动画。 |
ChartView.AllAnimations | 图表中已启用所有动画类型。 |
axes : list<AbstractAxis>
图表的坐标轴。
backgroundColor : color
图表背景的颜色。默认情况下,背景颜色由图表主题指定。
另请参见 theme 。
backgroundRoundness : real
图表背景四角的圆角直径。
count : int
添加到图表中的系列数。
dropShadowEnabled : bool
是否启用背景阴影效果。
如果设置为true ,则启用背景阴影效果。如果设置为false ,则禁用。
legend : Legend
图表的图例。图例列出了添加到图表中的所有系列、饼片和条形集。
locale : locale [since QtCharts 2.0]
用于格式化各种图表标签的本地语言。
只有当localizeNumbers 为true 时,标签才会本地化,但DateTimeAxis 标签除外,它始终使用此属性设置的QLocale 。
默认为构建图表时的应用程序默认语言。
此属性在 QtCharts 2.0 中引入。
另请参阅 localizeNumbers 。
localizeNumbers : bool [since QtCharts 2.0]
数字是否本地化。
当true 时,出现在各种系列和轴标签中的所有生成数字都将使用locale 属性设置的QLocale 进行本地化。当false 时,始终使用C语言。默认为false 。
注意: 该属性不影响DateTimeAxis 标签,后者始终使用通过 locale 属性设置的QLocale 。
该属性在 QtCharts 2.0 中引入。
另请参阅 locale 。
margins : Margins
图表矩形边缘与绘图区域之间允许的最小边距。边距用于绘制标题、坐标轴和图例。
plotArea : rect
绘制图表的矩形区域。
绘图区域不包括边距定义的区域。默认情况下,如果在ChartView 内,该矩形将调整大小。如果为绘图区域设置了明确的矩形,则将尊重该矩形,如果要恢复默认行为,则将其设置为Qt.rect(0, 0, 0, 0) 即可。
另请参见 margins 。
plotAreaColor : color
图表绘图区域背景的颜色。默认情况下,绘图区背景使用图表主题指定的图表背景颜色。
另请参阅 backgroundColor 和theme 。
theme : enumeration
图表使用的主题。
主题是与用户界面风格相关的内置设置集合,适用于图表的所有可视元素,如颜色、笔、刷子和系列字体,以及坐标轴、标题和图例。Qml 示波器示例说明了如何设置主题。
注意: 更改主题将覆盖之前应用于系列的所有自定义设置。
支持以下值:
| 常量 | 说明 |
|---|---|
ChartView.ChartThemeLight | 浅色主题,即默认主题。 |
ChartView.ChartThemeBlueCerulean | 蓝色主题。 |
ChartView.ChartThemeDark | 深色主题 |
ChartView.ChartThemeBrownSand | 沙棕色主题 |
ChartView.ChartThemeBlueNcs | 自然色系统(NCS)蓝色主题。 |
ChartView.ChartThemeHighContrast | 高对比度主题 |
ChartView.ChartThemeBlueIcy | 冰蓝色主题 |
ChartView.ChartThemeQt | Qt 主题 |
title : string
标题作为标题显示在图表顶部。图表标题支持 HTML 格式。
另请参见 titleColor 。
titleColor : color
标题文字的颜色。
titleFont : font
图表标题字体。
更多信息,请参见font 。
信号文档
seriesAdded(AbstractSeries series)
当系列series 添加到图表时,将发出该信号。
注: 相应的处理程序是onSeriesAdded 。
seriesRemoved(AbstractSeries series)
当系列series 从图表中移除时会发出该信号。信号处理完成后,系列对象将失效。
注: 相应的处理程序是onSeriesRemoved 。
方法文档
Axis axisX(AbstractSeries series)
series 的 x 轴。
另请参见 setAxisX() 。
Axis axisY(AbstractSeries series)
series 的 y 轴。
另请参见 setAxisY() 。
AbstractSeries createSeries(enumeration type, string name, AbstractAxis axisX, AbstractAxis axisY)
在图表中添加type 类型的系列,系列名称为name ,可选择轴axisX 和axisY 。例如
// lineSeries is a LineSeries object that has already been added to the ChartView; re-use its axes
var myAxisX = chartView.axisX(lineSeries);
var myAxisY = chartView.axisY(lineSeries);
var scatter = chartView.createSeries(ChartView.SeriesTypeScatter, "scatter series", myAxisX, myAxisY);
以下枚举值可用作type 的值:
| 常量 | 说明 |
|---|---|
ChartView.SeriesTypeLine | 线性系列。 |
ChartView.SeriesTypeArea | 面积序列。 |
ChartView.SeriesTypeBar | 条形数列 |
ChartView.SeriesTypeStackedBar | 叠加条形数列 |
ChartView.SeriesTypePercentBar | 百分比条形图系列 |
ChartView.SeriesTypeBoxPlot | 箱形图系列 |
ChartView.SeriesTypeCandlestick | 蜡烛图系列 |
ChartView.SeriesTypePie | 饼图系列 |
ChartView.SeriesTypeScatter | 散点图系列 |
ChartView.SeriesTypeSpline | 样条曲线系列 |
ChartView.SeriesTypeHorizontalBar | 水平条形图系列 |
ChartView.SeriesTypeHorizontalStackedBar | 水平叠加条形图序列 |
ChartView.SeriesTypeHorizontalPercentBar | 水平百分比条形数列 |
bool isZoomed()
如果有序列具有缩放域,则返回true 。
point mapToPosition(point value, AbstractSeries series)
返回value 系列中数值series 在图表中的位置。
point mapToValue(point position, AbstractSeries series)
返回series 系列中位于图表中position 位置的值。
void removeAllSeries()
删除图表中的所有系列,并永久删除所有系列对象。
void removeSeries(AbstractSeries series)
从图表中删除系列series 并永久删除系列对象。
void scrollDown(real pixels)
按pixels 指定的像素数向下滚动。这是一种方便的方法,适用于按键导航等。
void scrollLeft(real pixels)
按pixels 指定的像素数向左滚动。这是一种方便的方法,适用于按键导航等。
void scrollRight(real pixels)
向右滚动pixels 指定的像素数。这是一种方便的方法,适用于按键导航等。
void scrollUp(real pixels)
按pixels 指定的像素数向上滚动。这是一种方便的方法,适用于按键导航等。
AbstractSeries series(int index)
返回图表中索引为index 的系列。与图表的count 属性配合使用,可以循环查看图表中的系列。
另请参阅 count 。
AbstractSeries series(string name)
返回图表中名称为name 的第一个系列。如果没有以该名称命名的序列,则返回空值。
void setAxisX(AbstractAxis axis, AbstractSeries series)
将series 的 x 轴设置为axis 。
另请参阅 axisX() 。
void setAxisY(AbstractAxis axis, AbstractSeries series)
将series 的 Y 轴设置为axis 。
另请参阅 axisY() 。
void zoom(real factor)
按自定义系数factor 缩放到图表中。
系数超过 1.0 会放大视图,系数在 0.0 和 1.0 之间会缩小视图。
void zoomIn()
将视图放大两倍。
void zoomIn(rect rectangle)
将视图缩放到矩形rectangle 仍然完全可见的最大水平。
注: 极坐标图不支持此功能。
void zoomOut()
将视图缩小 2 倍。
注意: 如果结果包含无效的对数轴范围,该操作将不起任何作用。
void zoomReset()
将系列域重置为调用任何缩放方法之前的状态。
注: 此方法还将重置在第一次缩放操作和调用此方法之间指定的滚动和显式轴范围设置。如果未执行缩放操作,则此方法不会执行任何操作。
© 2026 The Qt Company Ltd. Documentation contributions included herein are the copyrights of their respective owners. The documentation provided herein is licensed under the terms of the GNU Free Documentation License version 1.3 as published by the Free Software Foundation. Qt and respective logos are trademarks of The Qt Company Ltd. in Finland and/or other countries worldwide. All other trademarks are property of their respective owners.
