使用模型数据
注: 这是带 Widgets 图库的图表示例的一部分。

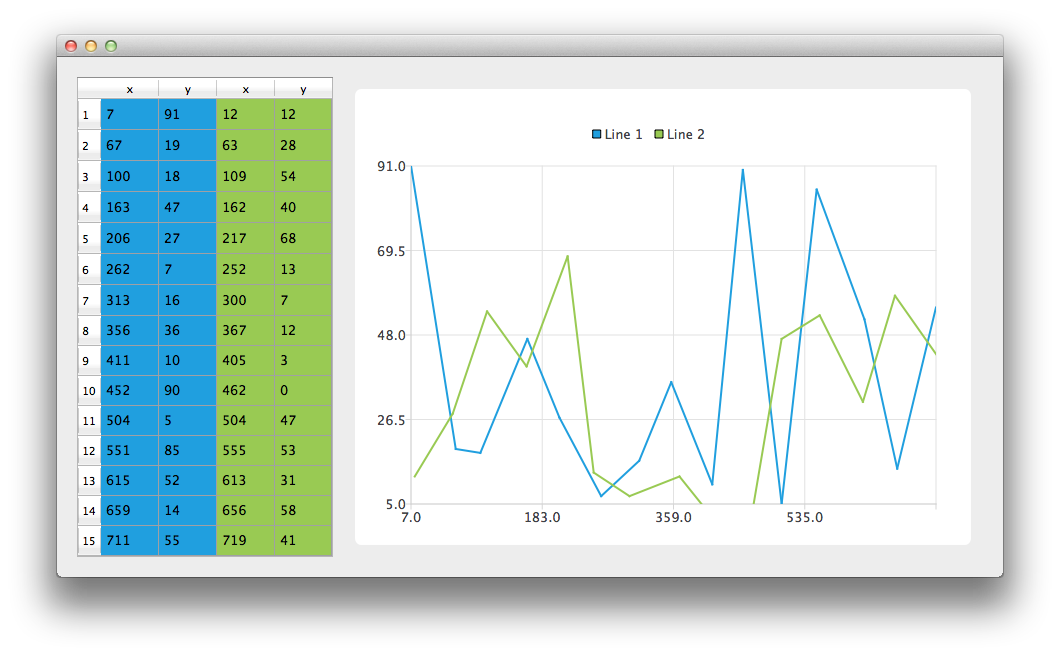
让我们先创建一个 CustomTableModel 类的实例。CustomTableModel 类派生自QAbstractTableModel ,它是为本示例的目的而创建的。该类的构造函数会将适合我们图表示例的数据填充到模型的内部数据存储中。
auto *model = new ModelDataModel;
现在我们有了一个模型,其中包含了我们希望在图表和QTableView 中显示的数据。首先,我们创建QTableView 并告诉它将模型用作数据源。为了让数据单元格填满表格视图,我们还改变了标题的大小调整模式。
// create table view and add model to it
auto tableView = new QTableView;
tableView->setModel(model);
tableView->horizontalHeader()->setSectionResizeMode(QHeaderView::Stretch);
tableView->verticalHeader()->setSectionResizeMode(QHeaderView::Stretch);
现在,我们需要QChart 实例在图表中显示相同的数据。我们还启用了动画。这样可以更容易地看到修改模型数据对图表的影响。
下面的代码创建了新的线性序列并为其命名。下面一行创建了QVXYModelMapper 类的实例。接下来的两行指定 X 坐标取自模型中索引为 0 的列(Qt::Vertical)。Y 坐标取自模型中索引为 1 的列。为了在序列和模型之间建立连接,我们将这两个对象都设置为QVXYModelMapper 。
最后,将序列添加到图表中。
auto series = new QLineSeries;
series->setName("Line 1");
auto mapper = new QVXYModelMapper(this);
mapper->setXColumn(0);
mapper->setYColumn(1);
mapper->setSeries(series);
mapper->setModel(model);
chart->addSeries(series);
为了在QTableView 中显示哪个数据对应哪个系列,本示例使用了表格着色。当系列添加到图表中时,会根据当前选择的主题为其分配一种颜色。下面的代码将从序列中提取该颜色,并使用它创建彩色QTableView 。视图着色不是QChart 功能的一部分。
// for storing color hex from the series
QString seriesColorHex = "#000000";

// get the color of the series and use it for showing the mapped area
seriesColorHex = "#" + QString::number(series->pen().color().rgb(), 16).right(6).toUpper();
model->addMapping(seriesColorHex, QRect(0, 0, 2, model->rowCount()));
同样的操作也适用于第二个系列。请注意,对于这个系列,同一模型的不同列进行了映射。
series = new QLineSeries;
series->setName("Line 2");

mapper = new QVXYModelMapper(this);
mapper->setXColumn(2);
mapper->setYColumn(3);
mapper->setSeries(series);
mapper->setModel(model);
chart->addSeries(series);
// get the color of the series and use it for showing the mapped area
seriesColorHex = "#" + QString::number(series->pen().color().rgb(), 16).right(6).toUpper();
model->addMapping(seriesColorHex, QRect(2, 0, 2, model->rowCount()));
为了避免设置QGraphicsScene ,我们使用QChartView 类来设置。QChart 对象指针被用作QChartView 构造函数的参数。为了让图表看起来更漂亮,我们打开了反锯齿功能,并设置了 chartView widget 的最小尺寸。
chart->createDefaultAxes();
chart->layout()->setContentsMargins(0, 0, 0, 0);
auto chartView = new QChartView(chart, this);
chartView->setRenderHint(QPainter::Antialiasing);
最后,我们将这两个部件放入一个布局中,并将该布局用作应用程序布局。
// create main layout
auto mainLayout = new QGridLayout;
mainLayout->addWidget(tableView, 1, 0);
mainLayout->addWidget(chartView, 1, 1);
mainLayout->setColumnStretch(1, 1);
mainLayout->setColumnStretch(0, 0);
setLayout(mainLayout);
应用程序准备就绪。尝试修改表格视图中的数据,看看对图表有什么影响。
© 2025 The Qt Company Ltd. Documentation contributions included herein are the copyrights of their respective owners. The documentation provided herein is licensed under the terms of the GNU Free Documentation License version 1.3 as published by the Free Software Foundation. Qt and respective logos are trademarks of The Qt Company Ltd. in Finland and/or other countries worldwide. All other trademarks are property of their respective owners.

