Qml 天气
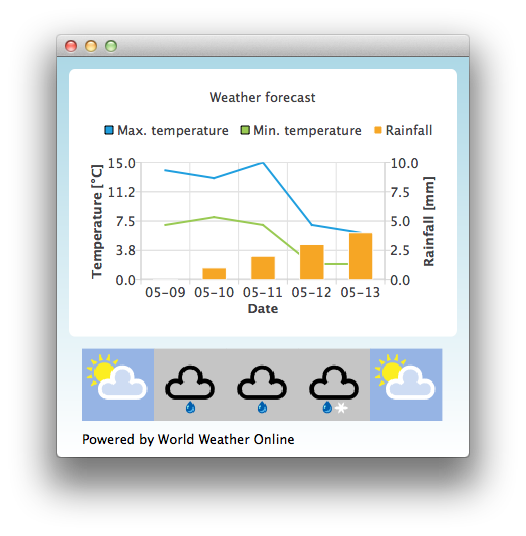
这是一个基本演示,展示如何使用 qml 来使用不同的图表类型。

默认情况下,应用程序使用静态测试数据来模拟天气预报。您还可以从 http://www.worldweatheronline.com/ 获取应用程序 ID,以访问世界天气在线提供的天气 API。然后,您可以将您的应用程序 ID 作为参数提供给 QML Live 可执行文件,使其使用实时数据。
例如
bin\qmlweather.exe 1234567890abcdef123456
运行示例
要从 Qt Creator,打开Welcome 模式并从Examples 中选择示例。更多信息,请参阅Qt Creator: 教程:构建并运行。
在Qt Quick 应用程序中使用图表
示例应用程序使用ChartView 和一些序列来可视化天气数据:
ChartView {
    id: chartView
    title: "Weather forecast"
    BarCategoryAxis {
        id: barCategoriesAxis
        titleText: "Date"
    }

    ValueAxis{
        id: valueAxisY2
        min: 0
        max: 10
        titleText: "Rainfall [mm]"
    }

    ValueAxis {
        id: valueAxisX
        // Hide the value axis; it is only used to map the line series to bar categories axis
        visible: false
        min: 0
        max: 5
    }

    ValueAxis{
        id: valueAxisY
        min: 0
        max: 15
        titleText: "Temperature [°C]"
    }

    LineSeries {
        id: maxTempSeries
        axisX: valueAxisX
        axisY: valueAxisY
        name: "Max. temperature"
    }

    LineSeries {
        id: minTempSeries
        axisX: valueAxisX
        axisY: valueAxisY
        name: "Min. temperature"
    }

    BarSeries {
        id: myBarSeries
        axisX: barCategoriesAxis
        axisYRight: valueAxisY2
        BarSet {
            id: rainfallSet
            label: "Rainfall"
        }
    }
为了获取天气预报数据,我们向世界天气在线发出 HTTP GET 请求。我们以 JSON 数据格式请求响应。
// Make HTTP GET request and parse the result
var xhr = new XMLHttpRequest;
xhr.open("GET",
         "http://free.worldweatheronline.com/feed/weather.ashx?q=Jyv%c3%a4skyl%c3%a4,Finland&format=json&num_of_days=5&key="
         + weatherAppKey);
xhr.onreadystatechange = function() {
    if (xhr.readyState == XMLHttpRequest.DONE) {
        var a = JSON.parse(xhr.responseText);
        parseWeatherData(a);
    }
}
xhr.send();
JSON 响应包含一个预报数据数组:
// Loop through the parsed JSON
for (var i in weatherData.data.weather) {
    var weatherObj = weatherData.data.weather[i];
然后将其用作我们系列的输入数据,以及用作天气图标 URL 容器的 ListModel:
// Store temperature values, rainfall and weather icon.
// The temperature values begin from 0.5 instead of 0.0 to make the start from the
// middle of the rainfall bars. This makes the temperature lines visually better
// synchronized with the rainfall bars.
maxTempSeries.append(Number(i) + 0.5, weatherObj.tempMaxC);
minTempSeries.append(Number(i) + 0.5, weatherObj.tempMinC);
rainfallSet.append(weatherObj.precipMM);
weatherImageModel.append({"imageSource":weatherObj.weatherIconUrl[0].value});
© 2025 The Qt Company Ltd. Documentation contributions included herein are the copyrights of their respective owners. The documentation provided herein is licensed under the terms of the GNU Free Documentation License version 1.3 as published by the Free Software Foundation. Qt and respective logos are trademarks of The Qt Company Ltd. in Finland and/or other countries worldwide. All other trademarks are property of their respective owners.

