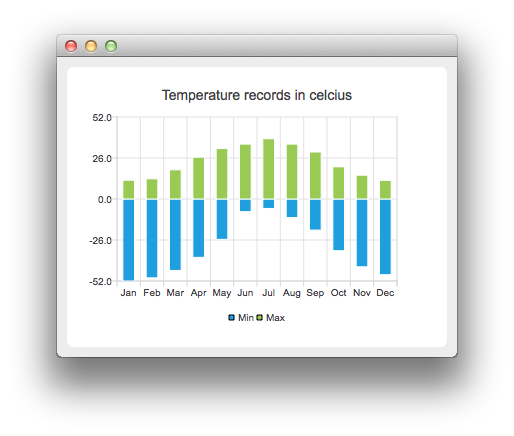
用负值柱显示温度记录
注: 这是带 Widgets 图库的图表示例的一部分。在示例中,我们使用温度数据。

首先,我们创建两个条形集,并将数据添加到其中。一组代表最低温度,另一组代表最高温度。
auto low = new QBarSet("Min");
auto high = new QBarSet("Max");

*low << -52 << -50 << -45.3 << -37.0 << -25.6 << -8.0
     << -6.0 << -11.8 << -19.7 << -32.8 << -43.0 << -48.0;
*high << 11.9 << 12.8 << 18.5 << 26.5 << 32.0 << 34.8
      << 38.2 << 34.8 << 29.8 << 20.4 << 15.1 << 11.8;
我们创建系列并将条形集添加到其中。系列拥有条形集的所有权。
auto series = new QStackedBarSeries;
series->append(low);
series->append(high);
在此,我们创建图表对象并添加系列。我们使用 setTitle 为图表设置标题,然后调用 setAnimationOptions(QChart::SeriesAnimations) 打开系列的动画。
auto chart = new QChart;
chart->addSeries(series);
chart->setTitle("Temperature records in Celcius");
chart->setAnimationOptions(QChart::SeriesAnimations);
要在坐标轴上显示类别,我们需要创建一个QBarCategoryAxis 。在这里,我们创建了一个包含类别列表的类别坐标轴,并将其添加到图表中,使其与底部对齐,充当 x 轴。图表拥有轴的所有权。对于 Y 轴,我们使用值轴,并将其对齐到左侧。我们改变了 Y 轴的范围,因为这比自动缩放的效果更好。
QStringList categories = {
    "Jan", "Feb", "Mar", "Apr", "May", "Jun", "Jul", "Aug", "Sep", "Oct", "Nov", "Dec"
};

auto axisX = new QBarCategoryAxis;
axisX->append(categories);
axisX->setTitleText("Month");
chart->addAxis(axisX, Qt::AlignBottom);
auto axisY = new QValueAxis;
axisY->setRange(-52, 52);
axisY->setTitleText("Temperature [°C]");
chart->addAxis(axisY, Qt::AlignLeft);
series->attachAxis(axisX);
series->attachAxis(axisY);
我们还想显示图例。为此,我们从图表中获取图例指针,并将其设置为可见。我们还将图例的对齐方式设置为Qt::AlignBottom ,从而将其置于图表底部。
chart->legend()->setVisible(true);
chart->legend()->setAlignment(Qt::AlignBottom);
最后,我们将图表添加到视图中。
createDefaultChartView(chart);
图表就可以显示了。
© 2025 The Qt Company Ltd. Documentation contributions included herein are the copyrights of their respective owners. The documentation provided herein is licensed under the terms of the GNU Free Documentation License version 1.3 as published by the Free Software Foundation. Qt and respective logos are trademarks of The Qt Company Ltd. in Finland and/or other countries worldwide. All other trademarks are property of their respective owners.

