
曲面图库
该图库展示了 Surface3D 图表的三种不同应用方式。
“曲面图库”演示了 Surface3D 图的三个不同自定义功能。这些功能在应用程序中各有独立的选项卡。
以下各节仅重点介绍这些功能,不再赘述基本功能——如需更详细的 QML 示例文档,请参阅《简单的散点图》。
运行示例
您可以通过以下方式运行示例:
- Qt Creator
打开Welcome 模式,并从Examples 中选择该示例。有关更多信息,请参阅Qt Creator :教程:构建与运行。
- Qt Extension for Visual Studio Code
在Command Palette 中运行Qt: Open Qt examples 命令,并从列表中选择该示例。有关更多信息,请参阅Qt Extension for Visual Studio Code :教程:构建和运行。
高程图
在“Height Map ”选项卡中,根据高程数据生成一个表面图。所用数据是新西兰鲁阿佩胡山和纳乌鲁霍伊山的高程图。
向图表添加数据
数据通过 HeightMapSurfaceDataProxy 进行设置,该代理从高程图图像中读取高程信息。该代理本身包含在 Surface3DSeries 中。 在 HeightMapSurfaceDataProxy 中,heightMapFile 属性指定了包含高度数据的图像文件。代理中的值属性定义了地表区域宽度、深度和高度的最小值与最大值。z 和x 的值以纬度和经度表示,大致对应现实世界中的位置,而y 的单位为米。
注意: 图表的纵横比 并未按实际比例设置,而是将高度进行了夸大处理。
Surface3DSeries {
    id: heightSeries
    flatShadingEnabled: false
    drawMode: Surface3DSeries.DrawSurface

    HeightMapSurfaceDataProxy {
        heightMapFile: "://qml/qmlsurfacegallery/heightmap.png"
        // We don't want the default data values set by heightmap proxy, but use
        // actual coordinate and height values instead
        autoScaleY: true
        minYValue: 740
        maxYValue: 2787
        minZValue: -374 // ~ -39.374411"N
        maxZValue: -116 // ~ -39.115971"N
        minXValue: 472  // ~ 175.471767"E
        maxXValue: 781  // ~ 175.780758"E
    }

    onDrawModeChanged: heightMapView.checkState()
}
显示数据
在main.qml 中,设置 Surface3D 元素以显示数据。
首先,定义用于曲面的自定义渐变。使用 ColorGradient 将颜色从位置 0.0 设置到 1.0,并增加两个额外停靠点以使图表更生动:
ColorGradient {
    id: surfaceGradient
    ColorGradientStop { position: 0.0; color: "darkgreen"}
    ColorGradientStop { position: 0.15; color: "darkslategray" }
    ColorGradientStop { position: 0.7; color: "peru" }
    ColorGradientStop { position: 1.0; color: "white" }
}
将此元素设置为 Surface3D 中使用的theme 对象的baseGradients 属性:
theme: Theme3D {
    type: Theme3D.ThemeStoneMoss
    font.family: "STCaiyun"
    font.pointSize: 35
    colorStyle: Theme3D.ColorStyleRangeGradient
    baseGradients: [surfaceGradient] // Use the custom gradient
}
使用这些按钮来控制 Surface3D 的其他功能。
第一个按钮用于切换曲面网格的显示与隐藏。由于绘制模式无法完全清除,因此除非曲面本身可见,否则无法隐藏曲面网格:
onClicked: {
    if (heightSeries.drawMode & Surface3DSeries.DrawWireframe)
        heightSeries.drawMode &= ~Surface3DSeries.DrawWireframe;
    else
        heightSeries.drawMode |= Surface3DSeries.DrawWireframe;
}
第二个按钮用于设置表面网格颜色:
onClicked: {
    if (Qt.colorEqual(heightSeries.wireframeColor, "#000000")) {
        heightSeries.wireframeColor = "red";
        text = "Black surface\ngrid color";
    } else {
        heightSeries.wireframeColor = "black";
        text = "Red surface\ngrid color";
    }
}
第三个按钮在表面绘制模式下切换表面显示与隐藏。由于绘制模式无法完全清除,因此除非表面网格可见,否则无法隐藏表面本身:
onClicked: {
    if (heightSeries.drawMode & Surface3DSeries.DrawSurface)
        heightSeries.drawMode &= ~Surface3DSeries.DrawSurface;
    else
        heightSeries.drawMode |= Surface3DSeries.DrawSurface;
}
第四个按钮用于设置着色模式。若在 OpenGL ES 系统上运行此示例,则无法使用平面着色:
onClicked: {
    if (heightSeries.flatShadingEnabled) {
        heightSeries.flatShadingEnabled = false;
        text = "Show\nFlat"
    } else {
        heightSeries.flatShadingEnabled = true;
        text = "Show\nSmooth"
    }
}
其余按钮用于控制图形背景功能。
频谱图
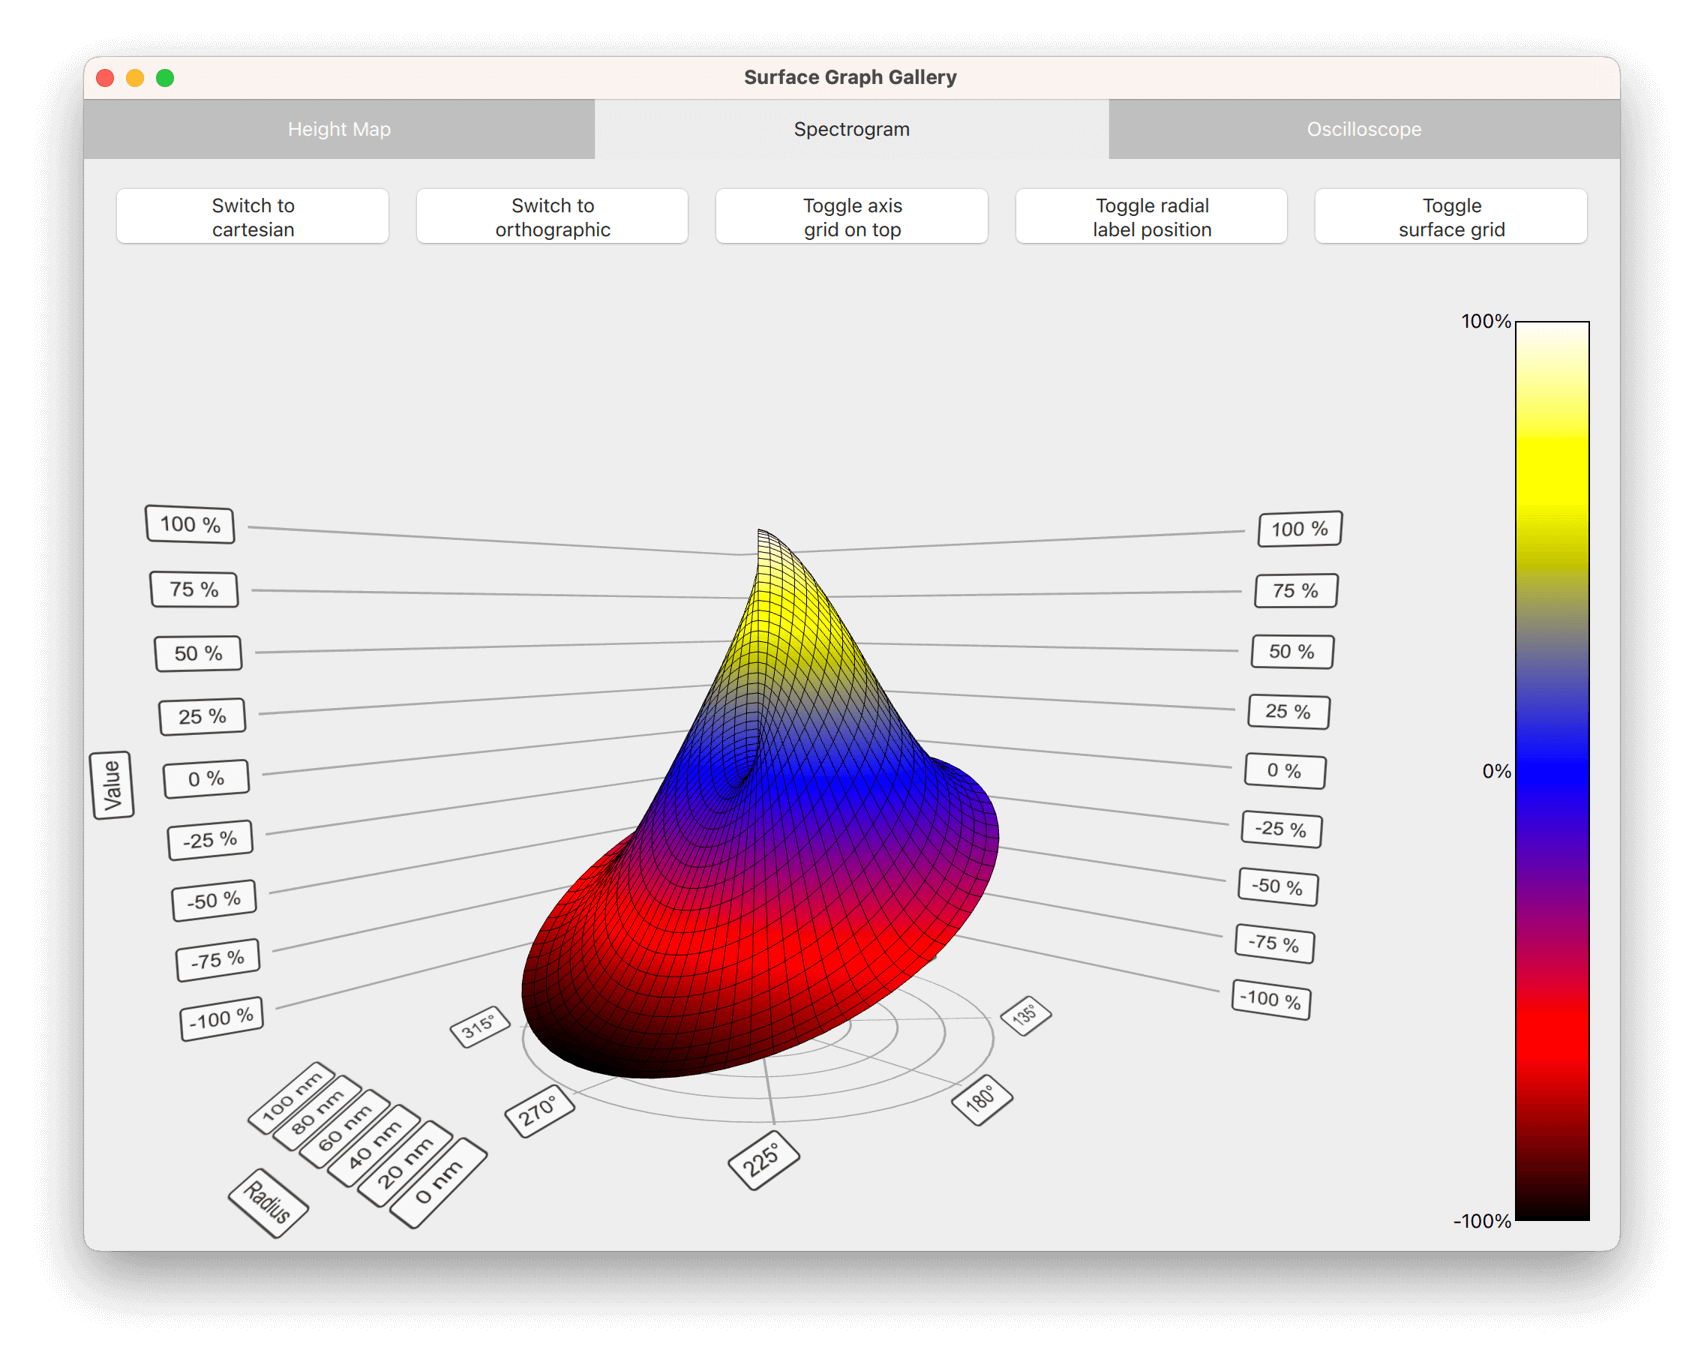
在“Spectrogram ”选项卡中,可显示极坐标和笛卡尔坐标谱图,并采用正投影将其以二维形式呈现。
频谱图是一种带有范围渐变的曲面图,用于突出显示不同的数值。通常,频谱图以二维曲面形式呈现,这通过图的俯视正交视图来模拟。为了强化二维效果,在正交模式下,请禁用通过鼠标或触摸操作旋转图形的功能。
创建频谱图
要创建二维频谱图,请定义一个 Surface3D 项,并使用 Surface3DSeries 中给定的数据,同时设置 ItemModelSurfaceDataProxy:
Surface3D {
    id: surfaceGraph
    anchors.fill: parent

    Surface3DSeries {
        id: surfaceSeries
        flatShadingEnabled: false
        drawMode: Surface3DSeries.DrawSurface
        baseGradient: surfaceGradient
        colorStyle: Theme3D.ColorStyleRangeGradient
        itemLabelFormat: "(@xLabel, @zLabel): @yLabel"

        ItemModelSurfaceDataProxy {
            itemModel: surfaceData.model
            rowRole: "radius"
            columnRole: "angle"
            yPosRole: "value"
        }
    }
实现 2D 效果的关键属性是 `orthoProjection ` 和 `scene.activeCamera.cameraPreset`。通过为图启用正交投影来消除透视效果,并通过从正上方直接查看图来消除 Y 维度:
// Remove the perspective and view the graph from top down to achieve 2D effect
orthoProjection: true
scene.activeCamera.cameraPreset: Camera3D.CameraPresetDirectlyAbove
由于此视角会导致水平轴网格大部分被曲面遮挡,请将水平网格翻转,使其绘制在图形上方:
flipHorizontalGrid: true极坐标谱图
根据数据的不同,有时使用极坐标图比使用笛卡尔坐标图更自然。这可以通过polar 属性实现。
添加一个按钮,用于在极坐标模式和笛卡尔坐标模式之间切换:
Button {
    id: polarToggle
    anchors.margins: 5
    anchors.left: parent.left
    anchors.top: parent.top
    width: spectrogramView.buttonWidth // Calculated elsewhere based on screen orientation
    text: "Switch to\n" + (surfaceGraph.polar ? "cartesian" : "polar")
    onClicked: surfaceGraph.polar = !surfaceGraph.polar;
}
在极坐标模式下,X 轴将转换为角极坐标轴,Z 轴将转换为径向极坐标轴。曲面上的点将根据新的坐标轴重新计算。
默认情况下,径向轴标签绘制在图表外部。若要将其绘制在图表内部、紧邻 0 度角轴的位置,只需为其定义一个较小的偏移量:
radialLabelOffset: 0.01为了确保 2D 效果,请通过自定义输入处理程序覆盖默认处理程序,该处理程序会根据投影模式自动切换 `rotationEnabled ` 属性,从而在正交模式下禁用图形旋转:
inputHandler: TouchInputHandler3D {
    rotationEnabled: !surfaceGraph.orthoProjection
}
示波器
在“Oscilloscope ”选项卡中,将 C++ 和 QML 结合到一个应用程序中,并显示动态变化的数据。
C++ 中的数据源
基于项模型的代理适用于简单或静态图表,但在显示实时变化的数据时,应使用基本代理以获得最佳性能。QML 不支持这些代理,因为它们存储的数据项不继承 `QObject ` 属性,因此无法直接通过 QML 代码进行操作。 为克服这一限制,请在 C++ 中实现一个简单的 `DataSource ` 类,用于填充该序列的数据代理。
创建一个 `DataSource ` 类,提供两个可从 QML 调用的方法:
class DataSource : public QObject
{
    Q_OBJECT
    ...
Q_INVOKABLE void generateData(int cacheCount, int rowCount, int columnCount,
                              float xMin, float xMax,
                              float yMin, float yMax,
                              float zMin, float zMax);

Q_INVOKABLE void update(QSurface3DSeries *series);
第一个方法 `generateData()` 用于创建一个模拟示波器数据的缓存以供显示。数据以 QSurfaceDataProxy 可接受的格式进行缓存:
// Populate caches
auto *generator = QRandomGenerator::global();
for (int i = 0; i < cacheCount; ++i) {
    QSurfaceDataArray &cache = m_data[i];
    float cacheXAdjustment = cacheStep * i;
    float cacheIndexAdjustment = cacheIndexStep * i;
    for (int j = 0; j < rowCount; ++j) {
        QSurfaceDataRow &row = *(cache[j]);
        float rowMod = (float(j)) / float(rowCount);
        float yRangeMod = yRange * rowMod;
        float zRangeMod = zRange * rowMod;
        float z = zRangeMod + zMin;
        qreal rowColWaveAngleMul = M_PI * M_PI * rowMod;
        float rowColWaveMul = yRangeMod * 0.2f;
        for (int k = 0; k < columnCount; k++) {
            float colMod = (float(k)) / float(columnCount);
            float xRangeMod = xRange * colMod;
            float x = xRangeMod + xMin + cacheXAdjustment;
            float colWave = float(qSin((2.0 * M_PI * colMod) - (1.0 / 2.0 * M_PI)) + 1.0);
            float y = (colWave * ((float(qSin(rowColWaveAngleMul * colMod) + 1.0))))
                    * rowColWaveMul
                    + generator->bounded(0.15f) * yRangeMod;

            int index = k + cacheIndexAdjustment;
            if (index >= columnCount) {
                // Wrap over
                index -= columnCount;
                x -= xRange;
            }
            row[index] = QVector3D(x, y, z);
        }
    }
}
第二个方法 `update()` 将一组缓存数据复制到另一个数组中,并通过调用 `QSurfaceDataProxy::resetArray()` 将其设置为该系列的数据代理。为尽量减少开销,如果数组维度未发生变化,则复用同一数组:
// Each iteration uses data from a different cached array
if (++m_index >= m_data.size())
    m_index = 0;

const QSurfaceDataArray &array = m_data.at(m_index);
int newRowCount = array.size();
int newColumnCount = array.at(0)->size();

// If the first time or the dimensions of the cache array have changed,
// reconstruct the reset array
if (!m_resetArray || series->dataProxy()->rowCount() != newRowCount
        || series->dataProxy()->columnCount() != newColumnCount) {
    m_resetArray = new QSurfaceDataArray();
    m_resetArray->reserve(newRowCount);
    for (int i = 0; i < newRowCount; ++i)
        m_resetArray->append(new QSurfaceDataRow(newColumnCount));
}

// Copy items from our cache to the reset array
for (int i = 0; i < newRowCount; ++i) {
    const QSurfaceDataRow &sourceRow = *(array.at(i));
    QSurfaceDataRow &row = *(*m_resetArray)[i];
    std::copy(sourceRow.cbegin(), sourceRow.cend(), row.begin());
}

// Notify the proxy that data has changed
series->dataProxy()->resetArray(m_resetArray);尽管我们操作的是先前已设置为代理的数组指针,但在更改数组中的数据后,仍需调用QSurfaceDataProxy::resetArray() 方法,以触发图表渲染数据。
为了能够从 QML 访问DataSource 的方法,请将 DataSource 声明为QML_ELEMENT 以公开数据源:
class DataSource : public QObject
{
    Q_OBJECT
    QML_ELEMENT
此外,在 CMakeLists.txt 中将其声明为 QML 模块:
qt6_add_qml_module(qmlsurfacegallery
    URI SurfaceGallery
    VERSION 1.0
    NO_RESOURCE_TARGET_PATH
    SOURCES
        datasource.cpp datasource.h
    ...
)
要在所有环境和构建中将 QSurface3DSeries 指针用作DataSource 类方法的参数,请确保已注册元类型:
qRegisterMetaType<QSurface3DSeries *>();QML 应用程序
要使用DataSource ,请导入该QML模块,并创建一个DataSource 实例以供使用:
import SurfaceGallery
...
DataSource {
    id: dataSource
}
定义一个 Surface3D 图,并为其指定一个 Surface3DSeries:
Surface3D {
    id: surfaceGraph
    anchors.fill: parent

    Surface3DSeries {
        id: surfaceSeries
        drawMode: Surface3DSeries.DrawSurfaceAndWireframe
        itemLabelFormat: "@xLabel, @zLabel: @yLabel"
请勿为连接到图表的 Surface3DSeries 指定代理。这样该系列将使用默认的 QSurfaceDataProxy。
使用 `itemLabelVisible` 隐藏项目标签。对于动态且变化迅速的数据,悬浮的选择标签会分散注意力且难以阅读。
itemLabelVisible: false您可以在 `Text ` 元素中显示所选项的信息,而不是使用位于选择指针上方的默认浮动标签:
onItemLabelChanged: {
    if (surfaceSeries.selectedPoint == surfaceSeries.invalidSelectionPosition)
        selectionText.text = "No selection";
    else
        selectionText.text = surfaceSeries.itemLabel;
}
在图表生成完成后,通过调用辅助函数 `generateData()` 初始化 `DataSource ` 缓存,该函数会调用 `DataSource` 中同名的方法:
Component.onCompleted: oscilloscopeView.generateData();
...
function generateData() {
    dataSource.generateData(oscilloscopeView.sampleCache, oscilloscopeView.sampleRows,
                            oscilloscopeView.sampleColumns,
                            surfaceGraph.axisX.min, surfaceGraph.axisX.max,
                            surfaceGraph.axisY.min, surfaceGraph.axisY.max,
                            surfaceGraph.axisZ.min, surfaceGraph.axisZ.max);
}
要触发数据的更新,请定义一个 `Timer`,该缓存会在指定的间隔内调用 `DataSource ` 中的 `update() ` 方法:
Timer {
    id: refreshTimer
    interval: 1000 / frequencySlider.value
    running: true
    repeat: true
    onTriggered: dataSource.update(surfaceSeries);
}
启用直接渲染
由于该应用程序可能处理大量快速变化的数据,因此为提高性能采用了直接渲染模式。若要在该模式下启用抗锯齿,请更改应用程序窗口的表面格式。QQuickView 使用的默认格式不支持抗锯齿。请使用main.cpp 中提供的实用函数来更改表面格式:
#include <QtDataVisualization/qutils.h>
...
// Enable antialiasing in direct rendering mode
viewer.setFormat(qDefaultSurfaceFormat(true));
示例内容
© 2026 The Qt Company Ltd. Documentation contributions included herein are the copyrights of their respective owners. The documentation provided herein is licensed under the terms of the GNU Free Documentation License version 1.3 as published by the Free Software Foundation. Qt and respective logos are trademarks of The Qt Company Ltd. in Finland and/or other countries worldwide. All other trademarks are property of their respective owners.
