
实现钻取功能
注意:这是 “带小部件的图表”示例库的一部分。
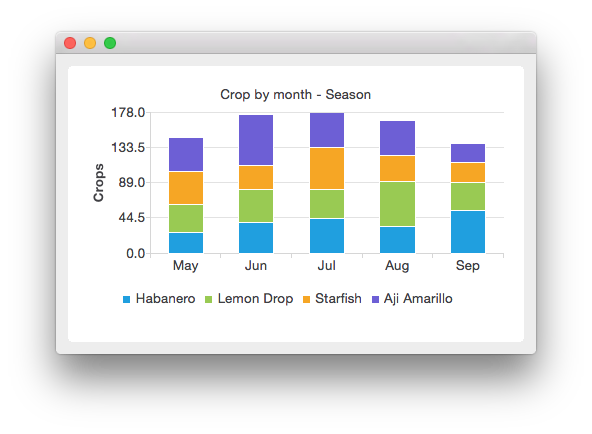
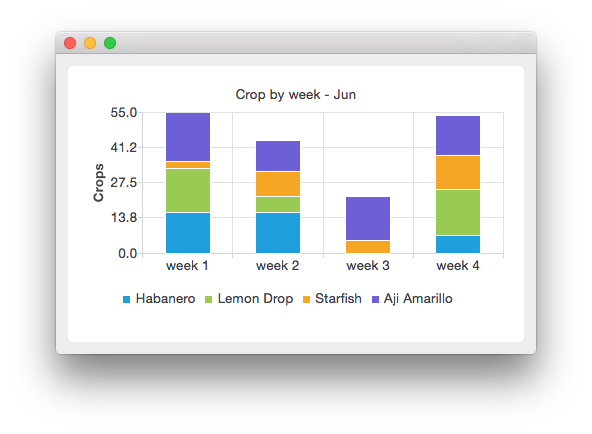
在此,我们将创建一个堆积条形图,展示不同品种辣椒在整个季节中的产量。在“季节视图”中,产量按月分组显示。若要钻取至“周视图”,请右键单击选中的月份。在“周视图”中,所点击月份的产量将按周显示。
季节视图如下所示:
点击某个月即可显示该月的收成:
首先,我们定义一个钻取系列类,该类为堆积条形图系列添加类别,并为类别映射到其他钻取系列。钻取系列的作用是包含有关钻取结构的信息。mapDrilldownSeries 函数将类别映射到给定的系列。 我们可以使用 `drilldownSeries(int category)` 函数查询某个类别的映射关系。
class StackedDrilldownSeries : public QStackedBarSeries
{
    Q_OBJECT
public:
    StackedDrilldownSeries(const QStringList &categories, int maxValue, QObject *parent = nullptr);

    void mapDrilldownSeries(int index, StackedDrilldownSeries *drilldownSeries);
    StackedDrilldownSeries *drilldownSeries(int index) const;
    QStringList categories() const;
    int maxValue() const;

private:
    QMap<int, StackedDrilldownSeries *> m_drilldownSeries;
    QStringList m_categories;
    int m_maxValue = 0;
};
接下来,我们定义自己的钻取图表,其中实现了鼠标点击的处理程序。所有从 QBarSeries 派生的类,当系列被鼠标点击时,都会发出 clicked(QBarSet*, int) 信号。参数 QBarSet 包含被点击的条形集的指针,参数 int 包含被点击类别的索引。
class StackedDrilldownChart : public QChart
{
    Q_OBJECT
public:
    explicit StackedDrilldownChart(QGraphicsItem *parent = nullptr, Qt::WindowFlags wFlags = {});

    void changeSeries(StackedDrilldownSeries *series);

public slots:
    void handleClicked(int index, QBarSet *);

private:
    StackedDrilldownSeries *m_currentSeries = nullptr;
    QBarCategoryAxis *m_axisX = nullptr;
    QValueAxis *m_axisY = nullptr;
};
现在我们已经有了钻取类,可以开始使用它们了。首先创建图表。
auto drilldownChart = new StackedDrilldownChart;
drilldownChart->setAnimationOptions(QChart::SeriesAnimations);
我们定义用于构建钻取系列的类别。
// Define categories
const QStringList months = {
    "May", "Jun", "Jul", "Aug", "Sep"
};
const QStringList weeks = {
    "week 1", "week 2", "week 3", "week 4"
};
const QStringList plants = {
    "Habanero", "Lemon Drop", "Starfish", "Aji Amarillo"
};
要创建钻取结构,我们首先创建顶级系列,将其命名为 seasonSeries。对于 seasonSeries 中的每个月,我们创建一个名为 weeklySeries 的钻取系列,其中包含该月的更详细数据。 在 `weeklySeries` 中,我们使用钻取处理程序将数据回溯到 `seasonSeries`。为此,我们为系列添加映射:每个月的 `seasonSeries` 映射到相应的 `weeklySeries`,而每个 `weeklySeries` 又映射回 `seasonSeries`。为了使映射生效,我们将系列中的点击信号连接到 `drilldownChart`。
// Create drilldown structure
auto seasonSeries = new StackedDrilldownSeries(months, 320, drilldownChart);
seasonSeries->setName("Crop by month - Season (Click on bar to drill down)");

// Each month in season series has drilldown series for weekly data
for (int month = 0; month < months.count(); month++) {
    // Create drilldown series for every week
    auto weeklySeries = new StackedDrilldownSeries(weeks, 80, drilldownChart);
    seasonSeries->mapDrilldownSeries(month, weeklySeries);

    // Drilling down from weekly data brings us back to season data.
    for (int week = 0; week < weeks.count(); week++) {
        weeklySeries->mapDrilldownSeries(week, seasonSeries);
        weeklySeries->setName(QString("Crop by week - " + months.at(month)));
    }

    // Use clicked signal to implement drilldown
    QObject::connect(weeklySeries, &StackedDrilldownSeries::clicked,
                     drilldownChart, &StackedDrilldownChart::handleClicked);
}

// Enable drilldown from season series using clicked signal
QObject::connect(seasonSeries, &StackedDrilldownSeries::clicked,
                 drilldownChart, &StackedDrilldownChart::handleClicked);
当钻取结构准备就绪后,我们可以向其中添加数据。在此,我们为每周的每株植物生成一个随机产量值。月产量基于每周产量计算得出,并作为值设置到月度系列中。
// Fill monthly and weekly series with data
for (const QString &plant : plants) {
    auto monthlyCrop = new QBarSet(plant);
    for (int month = 0; month < months.count(); month++) {
        auto weeklyCrop = new QBarSet(plant);
        for (int week = 0; week < weeks.count(); week++)
            *weeklyCrop << QRandomGenerator::global()->bounded(20);
        // Get the drilldown series from season series and add crop to it.
        seasonSeries->drilldownSeries(month)->append(weeklyCrop);
        *monthlyCrop << weeklyCrop->sum();
    }
    seasonSeries->append(monthlyCrop);
}
在此,我们将图表设置为初始时显示顶级系列。
// Show season series in initial view
drilldownChart->changeSeries(seasonSeries);
drilldownChart->setTitle(seasonSeries->name());
© 2026 The Qt Company Ltd. Documentation contributions included herein are the copyrights of their respective owners. The documentation provided herein is licensed under the terms of the GNU Free Documentation License version 1.3 as published by the Free Software Foundation. Qt and respective logos are trademarks of The Qt Company Ltd. in Finland and/or other countries worldwide. All other trademarks are property of their respective owners.
