Debugger Log
You can view debug output in the Debugger Log view to troubleshoot the debugger.
If debug output is sent to the system log, go to Preferences > Debugger > General and select Force logging to console.
Right-click the view to select the following actions:
- Copy, paste, cut, and delete log contents.
- Undo and redo editing actions.
- Select all log contents.
- Clear log contents.
- Save log contents as a file.
- Log time stamps.
- Reload debugging helpers after adding custom debugging helpers.
- Set debugger preferences.
Directly interacting with debuggers
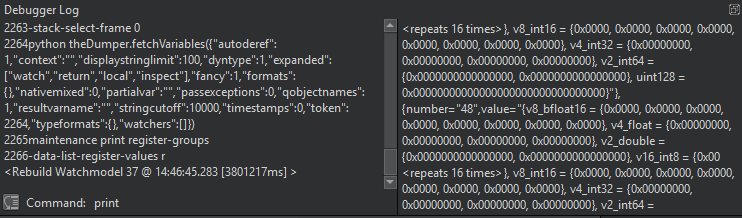
You can use the left pane of the Debugger Log view to directly interact with the command line of the debugger.
Select Ctrl+Enter to send the contents of the line under the text cursor to the debugger. Or, enter the command in the Command field. The right side pane of the Debugger Log view shows the command output.
Note: Usually, you do not need this feature because Qt Creator offers better ways to handle the task. For example, instead of using the GDB print command from the command line, you can evaluate an expression in the Expressions view.
See also How to: Debug, Debugging, and Debuggers.
Copyright © The Qt Company Ltd. and other contributors. Documentation contributions included herein are the copyrights of their respective owners. The documentation provided herein is licensed under the terms of the GNU Free Documentation License version 1.3 as published by the Free Software Foundation. Qt and respective logos are trademarks of The Qt Company Ltd in Finland and/or other countries worldwide. All other trademarks are property of their respective owners.
