Profiling QML applications
With QML Profiler, you can find causes for typical performance problems in your applications, such as slowness and unresponsive, stuttering user interfaces. Typical causes include executing too much JavaScript in too few frames. All JavaScript must return before the GUI thread can proceed, and frames are delayed or dropped if the GUI thread is not ready.
Another typical cause for similar performance problems is creating or updating invisible items, which takes time in the GUI thread.
Triggering long-running C++ functions, such as paint methods and signal handlers, also takes time in the GUI thread, but is more difficult to see in QML Profiler because it does not profile C++ code.
To find excessive use of JavaScript, check the frame rate in animations and Scene Graph events, look for gaps, and check whether the application behaves as expected. The JavaScript category displays the run time of functions, which you should try to keep below 16 ms per frame.
To find problems caused by handling invisible items, look for dropped frames and check that you are not using too many short bindings or signal handlers that are updated per frame. You can also visualize Scene Graph overdraw to check scene layout and find items that are never visible to the users because they are located outside the screen or hidden beneath other, visible elements.
If frames get dropped even though JavaScript is not being run, and there are large, unexplained gaps in the timeline, check your custom QQuickItem implementations. You can use Valgrind Callgrind or other general purpose profilers to analyze C++ code.
You can use full stack tracing to trace from the top level QML or JavaScript down to the C++ and all the way to the kernel space. You can view the collected data in the Chrome Trace Format Viewer.
Analyzing collected data
The Timeline view displays graphical representations of QML and JavaScript execution and a condensed view of all recorded events.
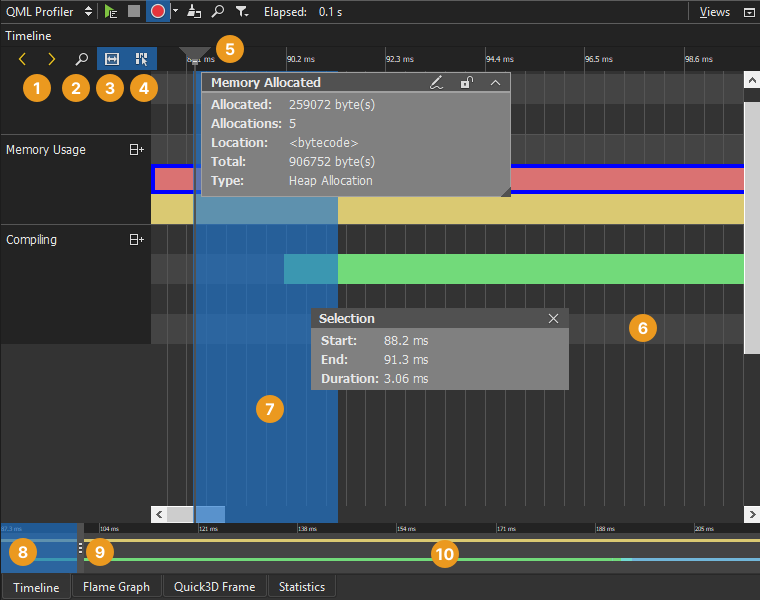
Each row in the timeline (6) describes a type of QML events that were recorded. Move the cursor on an event on a row to see how long it takes and where in the source it is being called. To display the information only when an event is selected, turn off View Event Information on Mouseover (4).
The outline (10) summarizes the period for which data was collected. Drag the zoom range (8) or click the outline to move on the outline. You can also move between events by selecting Jump to Previous Event and Jump to Next Event (1).
Select Show Zoom Slider (2) to open a slider that sets the zoom level. You can also drag the zoom handles (9). To reset the default zoom level, right-click the timeline to open the context menu, and select Reset Zoom.
Select the time ruler to add vertical orientation lines (5) to the timeline.
Selecting event ranges
Select an event range (7) to view the frame rate of events and to compare it with the frame rate of similar events. Select Select Range (3) to activate the selection tool. Then click in the timeline to specify the beginning of the event range. Drag the selection handle to define the end of the range. The length of the range indicates the frame rate of the event.
To measure delays between two subsequent events, place an event range between the end of the first event and the beginning of the second event. The Duration field displays the delay between the events in milliseconds.
To zoom into an event range, double-click it.
To narrow down the current range in the Timeline, Statistics, and Flame Graph views, right-click the range and select Analyze Current Range. To return to the full range, select Analyze Full Range in the context menu.
To remove an event range, close the Selection dialog.
Understanding the data
Generally, events in the timeline view indicate how long QML or JavaScript execution took. Move the mouse over them to see details. For most events, they include location in source code, duration and some relevant parts of the source code itself.
Select an event to move the cursor in the code editor to the part of the code the event is associated with.
The following types of events are displayed in the timeline view on one or several rows.
| Event Category | Description |
|---|---|
| Pixmap Cache | Displays the general amount of pixmap data cached, in pixels. In addition, displays a separate event for each picture being loaded, with specifics about its file name and size. |
| Scene Graph | Displays the time when scene graph frames are rendered and some additional timing information for the various stages executed to do so. |
| Memory Usage | Displays block allocations of the JavaScript memory manager. Generally, the memory manager will reserve larger blocks of memory in one piece and later hand them out to the application in smaller bits. If the application requests single blocks of memory surpassing a certain size, the memory manager will allocate those separately. Those two modes of operation are shown as events of different colors. The second row displays the actual usage of the allocated memory. This is the amount of JavaScript heap the application has actually requested. |
| Input Events | Displays mouse and keyboard events. |
| Painting | Not used. |
| Animations | Displays the amount of animations that are active and the frame rate that they are running at. Render thread animations are shown on a separate row. |
| Compiling | Displays the time spent compiling the QML files. |
| Creating | Displays the time spent creating the elements in the scene. The creation of elements takes place in two stages. The first stage is for the creation of the data structures, including child elements. The second stage represents the completion callbacks. Not all elements trigger completion callbacks, though. The stages are shown as separate events in the timeline. |
| Binding | Displays the time when a binding is evaluated and how long the evaluation takes. |
| Handling Signal | Displays the time when a signal is handled and how long the handling takes. |
| JavaScript | Displays the time spent executing the actual JavaScript behind bindings and signal handlers. It lists all the JavaScript functions you may be using to evaluate bindings or handle signals. |
| Quick3D | Displays the time spent rendering Qt Quick 3D frames, timing information for frame preparation and synchronization, particle system update times and particle update count, as well as texture and mesh memory allocations and memory consumption. This event type is available since Qt 6.3. |
Analyzing scene graph events
To understand the scene graph category, read more about how Qt Quick scene graph works in Qt Quick Scene Graph and Qt Quick Scene Graph Default Renderer. The following events are reported in the Scene Graph category. Not all events are generated by all render loops. In the Windows and Basic render loops everything runs in the same thread and the distinction between GUI thread and render thread is meaningless.
Set the environment variable QSG_RENDER_TIMING, to get a textual output of similar, but slightly different timings from the application being profiled. The differences are listed below.
| Event Type | Thread | Render Loop Types | Label in output of QSG_RENDER_TIMING | Description |
|---|---|---|---|---|
| Polish | GUI | Threaded, Basic, Windows | polish | Final touch-up of items before they are rendered using QQuickItem::updatePolish(). |
| GUI Thread Wait | GUI | Threaded | lock | Executing slots connected to the QQuickWindow::afterAnimating() signal and then locking the render thread's mutex before waiting on the same mutex at GUI Thread Sync. If this starts long before Render Thread Sync, there is free time in the GUI thread you could be using for running additional QML or JavaScript. |
| GUI Thread Sync | GUI | Threaded | blockedForSync | The time the GUI thread is blocked, waiting for the render thread. |
| Animations | GUI | Threaded, Windows | animations | Advancing animations in the GUI thread. The basic render loop does not drive animations in sync with the rendering. This is why no animation events will be shown when using the basic render loop. Watch the Animations category to see animation timing in this case. |
| Render Thread Sync | Render | Threaded, Basic, Windows | Frame rendered ... sync | Synchronizing the QML state into the scene graph using QQuickItem::updatePaintNode(). |
| Render | Render | Threaded, Basic, Windows | Frame rendered ... render | Total time spent rendering the frame, including preparing and uploading all the necessary data to the GPU. This is the gross render time. Do not confuse it with the net Render Render time below. |
| Swap | Render | Threaded, Basic, Windows | Frame rendered ... swap | Swapping frames after rendering. |
| Render Preprocess | Render | Threaded, Basic, Windows | time in renderer ... preprocess | Calling QSGNode::preprocess() on all nodes that need to be preprocessed. This is part of the gross Render step. |
| Render Update | Render | Threaded, Basic, Windows | time in renderer ... updates | Iterating and processing all the nodes in the scene graph to update their geometry, transformations, opacity, and other state. In the Render Thread Sync stage, each node is updated separately with state from the GUI thread. In Render Update, all the nodes are combined to create the final scene. This is part of the gross Render step. |
| Render Bind | Render | Threaded, Basic, Windows | time in renderer ... binding | Binding the correct framebuffer for OpenGL rendering. This is part of the gross Render step. |
| Render Render | Render | Threaded, Basic, Windows | time in renderer ... rendering | The actual process of sending all the data to the GPU via OpenGL. This is part of the gross Render step. |
| Material Compile | Render | Threaded, Basic, Windows | shader compiled | Compiling GLSL shader programs. |
| Glyph Render | Render | Threaded, Basic, Windows | glyphs ... rendering | Rendering of font glyphs into textures. |
| Glyph Upload | Render | Threaded, Basic, Windows | glyphs ... upload | Uploading of glyph textures to the GPU. |
| Texture Bind | Render | Threaded, Basic, Windows | plain texture ... bind | Binding a texture in the OpenGL context using glBindTextures. |
| Texture Convert | Render | Threaded, Basic, Windows | plain texture ... convert | Converting the format and downscaling an image to make it suitable for usage as a texture. |
| Texture Swizzle | Render | Threaded, Basic, Windows | plain texture ... swizzle | Swizzling the texture data on the CPU if necessary. |
| Texture Upload | Render | Threaded, Basic, Windows | plain texture ... upload / atlastexture uploaded | Uploading the texture data to the GPU. |
| Texture Mipmap | Render | Threaded, Basic, Windows | plain texture ... mipmap | Mipmapping a texture on the GPU. |
| Texture Delete | Render | Threaded, Basic, Windows | plain texture deleted | Deleting a texture from the GPU that became unnecessary. |
Analyzing Qt Quick 3D events
The following is the list of events for Qt Quick 3D. Each rendered frame consists of synchronize, prepare, and render phases, which are done in that order. Synchronize happens in scene graph synchronizing phase, while prepare and render happen in scene graph rendering phase.
Set the environment variable QSG_RENDERER_DEBUG=render to get additional textual output of render call counts of different rendering passes. These call counts are summed up in the Render Frame event.
| Event Type | Thread | Description |
|---|---|---|
| Render Frame | Render | Render time of a frame. Also shows the number of draw calls. |
| Prepare Frame | Render | Time taken for preparing a frame. Resources are allocated and loaded in the prepare phase. The first frame after scene loading usually takes longer than others since most resources are loaded at that time. |
| Synchronize Frame | Render | Synchronize time of a frame. Synchronize takes care of updating backend values from the frontend. Also manages shared resources between Qt Quick Scene Graph and Qt Quick 3D. |
| Mesh Load | Render | Load time of a mesh. Shows total memory usage of all meshes. Also shows unloads. |
| Custom Mesh Load | Render | Load time of a custom mesh. Shows total memory usage of all meshes. Also shows unloads. |
| Texture Load | Render | Load time of a texture. Shows total memory usage of all textures. Also shows unloads. |
| Generate Shader | Render | Time for generating a shader for a material. |
| Load Shader | Render | Time for loading a built-in shader. |
| Particle Update | GUI | Update time of a particle system. Shows the number of particles updated. |
| Mesh Memory Consumption | Render | Shows a bar view of total mesh memory consumption. |
| Texture Memory Consumption | Render | Shows a bar view of total texture memory consumption. |
| Render Call | Render | Time taken by a single draw or compute call. Useful for identifying heavy GPU operations. |
| Render Pass | Render | Time taken by an entire render pass. Shows grouped rendering operations for frame buffers. |
Viewing statistics
The Statistics view displays the number of times each binding, create, compile, JavaScript, or signal event is triggered and the average time it takes. Examine the statistics to learn which events to optimize. A high number of occurrences might indicate that an event is triggered unnecessarily. To view the median, longest, and shortest time for the occurrences, select Extended Event Statistics in the context menu.
Select an event to move to it in the source code in the code editor.
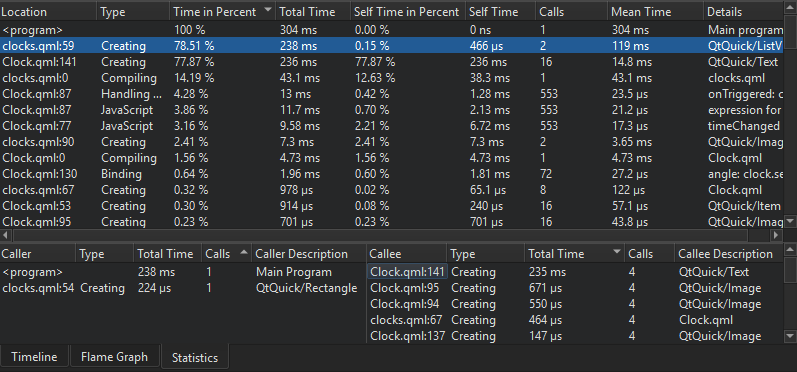
Callers and Callees show dependencies between events. They allow you to examine the internal functions of the application. Callers summarizes the QML events that trigger a binding. This tells you what caused a change in a binding. Callees summarizes the QML events that a binding triggers. This tells you which QML events are affected if you change a binding.
Select an event to move to it in the source code in the code editor.
When you select an event in the Timeline view, information about it is displayed in the Statistics and Flame Graph views.
To copy the contents of one view or row to the clipboard, select Copy Table or Copy Row in the context menu.
Visualizing statistics as flame graphs
The Flame Graph view shows a more concise statistical overview of QML and JavaScript execution. In the Total Time view, the horizontal bars show the amount of time all invocations of a certain function took together, relative to the total runtime of all JavaScript and QML events. The nesting shows which functions were called by which other ones.
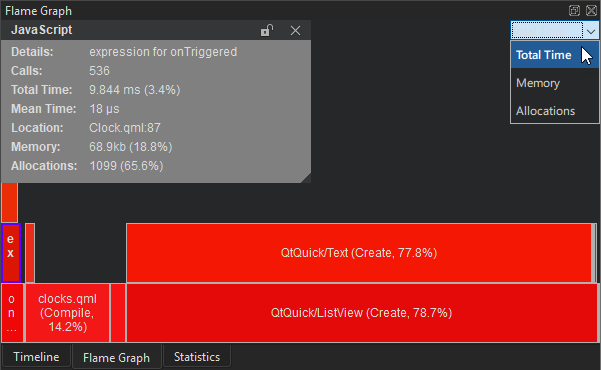
To view the total amount of memory allocated by the functions, select Memory in the drop-down menu.
To view the number of memory allocations performed by the functions, select Allocations.
Double-click an item in a view to zoom into it. Double-click an empty area in the view to zoom out again.
Unlike the Timeline view, the Flame Graph view does not show the time spans when no QML or JavaScript is running at all. Thus, it is not suitable for analyzing per frame execution times. However, it is very easy to see the total impact of the various QML and JavaScript events there.
See also How to: Analyze, Analyzers, Analyzing code, and Profile QML applications.
Copyright © The Qt Company Ltd. and other contributors. Documentation contributions included herein are the copyrights of their respective owners. The documentation provided herein is licensed under the terms of the GNU Free Documentation License version 1.3 as published by the Free Software Foundation. Qt and respective logos are trademarks of The Qt Company Ltd in Finland and/or other countries worldwide. All other trademarks are property of their respective owners.
