
Q3DBars
The Q3DBars class provides methods for rendering 3D bar graphs. More…
Synopsis
Functions
def
addAxis(axis)def
addSeries(series)def
axes()def
barSpacing()def
barThickness()def
columnAxis()def
floorLevel()def
insertSeries(index, series)def
isBarSpacingRelative()def
isMultiSeriesUniform()def
primarySeries()def
releaseAxis(axis)def
removeSeries(series)def
rowAxis()def
selectedSeries()def
seriesList()def
setBarSpacing(spacing)def
setBarSpacingRelative(relative)def
setBarThickness(thicknessRatio)def
setColumnAxis(axis)def
setFloorLevel(level)def
setMultiSeriesUniform(uniform)def
setPrimarySeries(series)def
setRowAxis(axis)def
setValueAxis(axis)def
valueAxis()
Signals
def
barSpacingChanged(spacing)def
barSpacingRelativeChanged(relative)def
barThicknessChanged(thicknessRatio)def
columnAxisChanged(axis)def
floorLevelChanged(level)def
multiSeriesUniformChanged(uniform)def
primarySeriesChanged(series)def
rowAxisChanged(axis)def
selectedSeriesChanged(series)def
valueAxisChanged(axis)
Detailed Description
This class enables developers to render bar graphs in 3D and to view them by rotating the scene freely. Rotation is done by holding down the right mouse button and moving the mouse. Zooming is done by mouse wheel. Selection, if enabled, is done by left mouse button. The scene can be reset to default camera view by clicking mouse wheel. In touch devices rotation is done by tap-and-move, selection by tap-and-hold and zoom by pinch.
If no axes are set explicitly to Q3DBars , temporary default axes with no labels are created. These default axes can be modified via axis accessors, but as soon any axis is set explicitly for the orientation, the default axis for that orientation is destroyed.
Q3DBars supports more than one series visible at the same time. It is not necessary for all series to have the same amount of rows and columns. Row and column labels are taken from the first added series, unless explicitly defined to row and column axes.
How to construct a minimal Q3DBars graph
First, construct an instance of Q3DBars . Since we are running the graph as top level window in this example, we need to clear the Qt::FramelessWindowHint flag, which gets set by default:
bars = Q3DBars()
bars.setFlags(bars.flags() ^ Qt.FramelessWindowHint)
After constructing Q3DBars , you can set the data window by changing the range on the row and column axes. It is not mandatory, as data window will default to showing all of the data in the series. If the amount of data is large, it is usually preferable to show just a portion of it. For the example, let’s set the data window to show first five rows and columns:
bars.rowAxis().setRange(0, 4)
bars.columnAxis().setRange(0, 4)
Now Q3DBars is ready to receive data to be rendered. Create a series with one row of 5 values:
series = QBar3DSeries()
data = QBarDataRow()
data << 1.0f << 3.0f << 7.5f << 5.0f << 2.2f
series.dataProxy().addRow(data)
bars.addSeries(series)
Note
We set the data window to 5 x 5, but we are adding only one row of data. This is ok, the rest of the rows will just be blank.
Finally you will need to set it visible:
bars.show()
The complete code needed to create and display this graph is:
from PySide6 import QtDataVisualization
if __name__ == "__main__":

    qputenv("QSG_RHI_BACKEND", "opengl")
    app = QGuiApplication(argc, argv)

    bars = Q3DBars()
    bars.setFlags(bars.flags() ^ Qt.FramelessWindowHint)


    bars.rowAxis().setRange(0, 4)
    bars.columnAxis().setRange(0, 4)


    series = QBar3DSeries()
    data = QBarDataRow()
    data << 1.0f << 3.0f << 7.5f << 5.0f << 2.2f
    series.dataProxy().addRow(data)
    bars.addSeries(series)


    bars.show()

    sys.exit(app.exec())
And this is what those few lines of code produce:
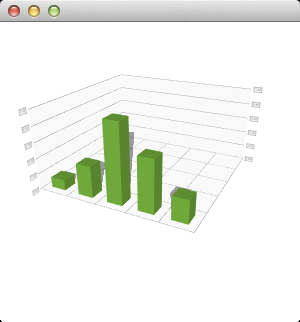
The scene can be rotated, zoomed into, and a bar can be selected to view its value, but no other interaction is included in this minimal code example. You can learn more by familiarizing yourself with the examples provided, like the Bars Example .
- class PySide6.QtDataVisualization.Q3DBars([format=None[, parent=None]])
- Parameters
format –
PySide6.QtGui.QSurfaceFormatparent –
PySide6.QtGui.QWindow
Constructs a new 3D bar graph with optional parent window and surface format.
- PySide6.QtDataVisualization.Q3DBars.addAxis(axis)
- Parameters
Adds axis to the graph. The axes added via are not yet taken to use, is simply used to give the ownership of the axis to the graph. The axis must not be null or added to another graph.
- PySide6.QtDataVisualization.Q3DBars.addSeries(series)
- Parameters
Adds the series to the graph. A graph can contain multiple series, but only one set of axes, so the rows and columns of all series must match for the visualized data to be meaningful. If the graph has multiple visible series, only the primary series will generate the row or column labels on the axes in cases where the labels are not explicitly set to the axes. If the newly added series has specified a selected bar, it will be highlighted and any existing selection will be cleared. Only one added series can have an active selection.
See also
- PySide6.QtDataVisualization.Q3DBars.axes()
- Return type
Returns the list of all added axes.
See also
- PySide6.QtDataVisualization.Q3DBars.barSpacing()
- Return type
This property holds Bar spacing in the X and Z dimensions..
Preset to (1.0, 1.0) by default. Spacing is affected by the barSpacingRelative property.
See also
barSpacingRelativemultiSeriesUniform
- PySide6.QtDataVisualization.Q3DBars.barSpacingChanged(spacing)
- Parameters
spacing –
PySide6.QtCore.QSizeF
- PySide6.QtDataVisualization.Q3DBars.barSpacingRelativeChanged(relative)
- Parameters
relative – bool
- PySide6.QtDataVisualization.Q3DBars.barThickness()
- Return type
float
This property holds The bar thickness ratio between the X and Z dimensions..
The value 1.0 means that the bars are as wide as they are deep, whereas 0.5 makes them twice as deep as they are wide. Preset to 1.0 by default.
- PySide6.QtDataVisualization.Q3DBars.barThicknessChanged(thicknessRatio)
- Parameters
thicknessRatio – float
- PySide6.QtDataVisualization.Q3DBars.columnAxis()
- Return type
This property holds The axis attached to the active column..
- PySide6.QtDataVisualization.Q3DBars.columnAxisChanged(axis)
- Parameters
- PySide6.QtDataVisualization.Q3DBars.floorLevel()
- Return type
float
This property holds The floor level for the bar graph in Y-axis data coordinates..
The actual floor level will be restricted by the Y-axis minimum and maximum values. Defaults to zero.
- PySide6.QtDataVisualization.Q3DBars.floorLevelChanged(level)
- Parameters
level – float
- PySide6.QtDataVisualization.Q3DBars.insertSeries(index, series)
- Parameters
index – int
Inserts the series into the position index in the series list. If the series has already been added to the list, it is moved to the new index.
Note
When moving a series to a new index that is after its old index, the new position in list is calculated as if the series was still in its old index, so the final index is actually the index decremented by one.
See also
- PySide6.QtDataVisualization.Q3DBars.isBarSpacingRelative()
- Return type
bool
This property holds Whether spacing is absolute or relative to bar thickness..
If it is true, the value of 0.0 means that the bars are placed side-to-side, 1.0 means that a space as wide as the thickness of one bar is left between the bars, and so on. Preset to true.
- PySide6.QtDataVisualization.Q3DBars.isMultiSeriesUniform()
- Return type
bool
This property holds Whether bars are to be scaled with proportions set to a single series bar even if there are multiple series displayed..
If set to true, bar spacing will be correctly applied only to the X-axis. Preset to false by default.
- PySide6.QtDataVisualization.Q3DBars.multiSeriesUniformChanged(uniform)
- Parameters
uniform – bool
- PySide6.QtDataVisualization.Q3DBars.primarySeries()
- Return type
This property holds The primary series of the graph..
- PySide6.QtDataVisualization.Q3DBars.primarySeriesChanged(series)
- Parameters
- PySide6.QtDataVisualization.Q3DBars.releaseAxis(axis)
- Parameters
Releases the ownership of the axis back to the caller, if it is added to this graph. If the released axis is in use, a new default axis will be created and set active.
If the default axis is released and added back later, it behaves as any other axis would.
- PySide6.QtDataVisualization.Q3DBars.removeSeries(series)
- Parameters
Removes the series from the graph.
- PySide6.QtDataVisualization.Q3DBars.rowAxis()
- Return type
This property holds The axis attached to the active row..
- PySide6.QtDataVisualization.Q3DBars.rowAxisChanged(axis)
- Parameters
- PySide6.QtDataVisualization.Q3DBars.selectedSeries()
- Return type
This property holds The selected series or a null value..
If selectionMode has the SelectionMultiSeries flag set, this property holds the series that owns the selected bar.
- PySide6.QtDataVisualization.Q3DBars.selectedSeriesChanged(series)
- Parameters
- PySide6.QtDataVisualization.Q3DBars.seriesList()
- Return type
Returns the list of series added to this graph.
- PySide6.QtDataVisualization.Q3DBars.setBarSpacing(spacing)
- Parameters
spacing –
PySide6.QtCore.QSizeF
This property holds Bar spacing in the X and Z dimensions..
Preset to (1.0, 1.0) by default. Spacing is affected by the barSpacingRelative property.
See also
barSpacingRelativemultiSeriesUniform
- PySide6.QtDataVisualization.Q3DBars.setBarSpacingRelative(relative)
- Parameters
relative – bool
This property holds Whether spacing is absolute or relative to bar thickness..
If it is true, the value of 0.0 means that the bars are placed side-to-side, 1.0 means that a space as wide as the thickness of one bar is left between the bars, and so on. Preset to true.
- PySide6.QtDataVisualization.Q3DBars.setBarThickness(thicknessRatio)
- Parameters
thicknessRatio – float
This property holds The bar thickness ratio between the X and Z dimensions..
The value 1.0 means that the bars are as wide as they are deep, whereas 0.5 makes them twice as deep as they are wide. Preset to 1.0 by default.
- PySide6.QtDataVisualization.Q3DBars.setColumnAxis(axis)
- Parameters
This property holds The axis attached to the active column..
- PySide6.QtDataVisualization.Q3DBars.setFloorLevel(level)
- Parameters
level – float
This property holds The floor level for the bar graph in Y-axis data coordinates..
The actual floor level will be restricted by the Y-axis minimum and maximum values. Defaults to zero.
- PySide6.QtDataVisualization.Q3DBars.setMultiSeriesUniform(uniform)
- Parameters
uniform – bool
This property holds Whether bars are to be scaled with proportions set to a single series bar even if there are multiple series displayed..
If set to true, bar spacing will be correctly applied only to the X-axis. Preset to false by default.
- PySide6.QtDataVisualization.Q3DBars.setPrimarySeries(series)
- Parameters
This property holds The primary series of the graph..
- PySide6.QtDataVisualization.Q3DBars.setRowAxis(axis)
- Parameters
This property holds The axis attached to the active row..
- PySide6.QtDataVisualization.Q3DBars.setValueAxis(axis)
- Parameters
Sets the active value axis (the Y-axis) to axis. Implicitly calls addAxis() to transfer the ownership of axis to this graph.
If axis is null, a temporary default axis with no labels and an automatically adjusting range is created. This temporary axis is destroyed if another axis is set explicitly to the same orientation.
See also
- PySide6.QtDataVisualization.Q3DBars.valueAxis()
- Return type
Sets the active value axis (the Y-axis) to axis. Implicitly calls addAxis() to transfer the ownership of axis to this graph.
If axis is null, a temporary default axis with no labels and an automatically adjusting range is created. This temporary axis is destroyed if another axis is set explicitly to the same orientation.
See also
- PySide6.QtDataVisualization.Q3DBars.valueAxisChanged(axis)
- Parameters
© 2022 The Qt Company Ltd. Documentation contributions included herein are the copyrights of their respective owners. The documentation provided herein is licensed under the terms of the GNU Free Documentation License version 1.3 as published by the Free Software Foundation. Qt and respective logos are trademarks of The Qt Company Ltd. in Finland and/or other countries worldwide. All other trademarks are property of their respective owners.