
Q3DSurface
The Q3DSurface class provides methods for rendering 3D surface plots. More…
Synopsis
Functions
def
addAxis(axis)def
addSeries(series)def
axes()def
axisX()def
axisY()def
axisZ()def
flipHorizontalGrid()def
releaseAxis(axis)def
removeSeries(series)def
selectedSeries()def
seriesList()def
setAxisX(axis)def
setAxisY(axis)def
setAxisZ(axis)def
setFlipHorizontalGrid(flip)
Signals
def
axisXChanged(axis)def
axisYChanged(axis)def
axisZChanged(axis)def
flipHorizontalGridChanged(flip)def
selectedSeriesChanged(series)
Detailed Description
This class enables developers to render 3D surface plots and to view them by rotating the scene freely. The visual properties of the surface such as draw mode and shading can be controlled via QSurface3DSeries .
The Q3DSurface supports selection by showing a highlighted ball on the data point where the user has clicked with left mouse button (when default input handler is in use) or selected via QSurface3DSeries . The selection pointer is accompanied with a label which in default case shows the value of the data point and the coordinates of the point.
The value range and the label format shown on the axis can be controlled through QValue3DAxis .
To rotate the graph, hold down the right mouse button and move the mouse. Zooming is done using mouse wheel. Both assume the default input handler is in use.
If no axes are set explicitly to Q3DSurface , temporary default axes with no labels are created. These default axes can be modified via axis accessors, but as soon any axis is set explicitly for the orientation, the default axis for that orientation is destroyed.
How to construct a minimal Q3DSurface graph
First, construct Q3DSurface . Since we are running the graph as top level window in this example, we need to clear the Qt::FramelessWindowHint flag, which gets set by default:
surface = Q3DSurface()
surface.setFlags(surface.flags() ^ Qt.FramelessWindowHint)
Now Q3DSurface is ready to receive data to be rendered. Create data elements to receive values:
data = QSurfaceDataArray()
dataRow1 = QSurfaceDataRow()
dataRow2 = QSurfaceDataRow()
First feed the data to the row elements and then add their pointers to the data element:
dataRow1 << QVector3D(0.0f, 0.1f, 0.5f) << QVector3D(1.0f, 0.5f, 0.5f)
dataRow2 << QVector3D(0.0f, 1.8f, 1.0f) << QVector3D(1.0f, 1.2f, 1.0f)
data << dataRow1 << dataRow2
Create a new series and set data to it:
series = QSurface3DSeries()
series.dataProxy().resetArray(data)
surface.addSeries(series)
Finally you will need to set it visible:
surface.show()
The complete code needed to create and display this graph is:
from PySide6 import QtDataVisualization
if __name__ == "__main__":

    qputenv("QSG_RHI_BACKEND", "opengl")
    app = QGuiApplication(argc, argv)

    surface = Q3DSurface()
    surface.setFlags(surface.flags() ^ Qt.FramelessWindowHint)


    data = QSurfaceDataArray()
    dataRow1 = QSurfaceDataRow()
    dataRow2 = QSurfaceDataRow()


    dataRow1 << QVector3D(0.0f, 0.1f, 0.5f) << QVector3D(1.0f, 0.5f, 0.5f)
    dataRow2 << QVector3D(0.0f, 1.8f, 1.0f) << QVector3D(1.0f, 1.2f, 1.0f)
    data << dataRow1 << dataRow2


    series = QSurface3DSeries()
    series.dataProxy().resetArray(data)
    surface.addSeries(series)


    surface.show()

    sys.exit(app.exec())
And this is what those few lines of code produce:
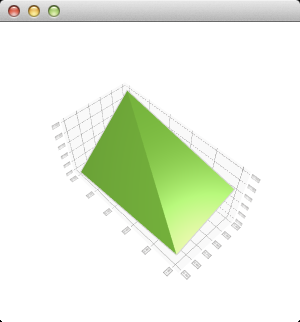
The scene can be rotated, zoomed into, and a surface point can be selected to view its position, but no other interaction is included in this minimal code example. You can learn more by familiarizing yourself with the examples provided, like the Surface Example .
- class PySide6.QtDataVisualization.Q3DSurface([format=None[, parent=None]])
- Parameters
format –
PySide6.QtGui.QSurfaceFormatparent –
PySide6.QtGui.QWindow
Constructs a new 3D surface graph with optional parent window and surface format.
- PySide6.QtDataVisualization.Q3DSurface.addAxis(axis)
- Parameters
Adds axis to the graph. The axes added via are not yet taken to use, is simply used to give the ownership of the axis to the graph. The axis must not be null or added to another graph.
See also
- PySide6.QtDataVisualization.Q3DSurface.addSeries(series)
- Parameters
Adds the series to the graph. A graph can contain multiple series, but has only one set of axes. If the newly added series has specified a selected item, it will be highlighted and any existing selection will be cleared. Only one added series can have an active selection.
- PySide6.QtDataVisualization.Q3DSurface.axes()
- Return type
Returns the list of all added axes.
See also
- PySide6.QtDataVisualization.Q3DSurface.axisX()
- Return type
This property holds The active x-axis..
- PySide6.QtDataVisualization.Q3DSurface.axisXChanged(axis)
- Parameters
- PySide6.QtDataVisualization.Q3DSurface.axisY()
- Return type
This property holds The active y-axis..
- PySide6.QtDataVisualization.Q3DSurface.axisYChanged(axis)
- Parameters
- PySide6.QtDataVisualization.Q3DSurface.axisZ()
- Return type
This property holds The active z-axis..
- PySide6.QtDataVisualization.Q3DSurface.axisZChanged(axis)
- Parameters
- PySide6.QtDataVisualization.Q3DSurface.flipHorizontalGrid()
- Return type
bool
This property holds Whether the horizontal axis grid is displayed on top of the graph rather than on the bottom..
In some use cases the horizontal axis grid is mostly covered by the surface, so it can be more useful to display the horizontal axis grid on top of the graph rather than on the bottom. A typical use case for this is showing 2D spectrograms using orthoGraphic projection with a top-down viewpoint.
If false, the horizontal axis grid and labels are drawn on the horizontal background of the graph. If true, the horizontal axis grid and labels are drawn on the opposite side of the graph from the horizontal background. Defaults to false.
- PySide6.QtDataVisualization.Q3DSurface.flipHorizontalGridChanged(flip)
- Parameters
flip – bool
- PySide6.QtDataVisualization.Q3DSurface.releaseAxis(axis)
- Parameters
Releases the ownership of the axis back to the caller, if it is added to this graph. If the released axis is in use, a new default axis will be created and set active.
If the default axis is released and added back later, it behaves as any other axis would.
See also
- PySide6.QtDataVisualization.Q3DSurface.removeSeries(series)
- Parameters
Removes the series from the graph.
- PySide6.QtDataVisualization.Q3DSurface.selectedSeries()
- Return type
This property holds The selected series or null..
If selectionMode has SelectionMultiSeries set, this property holds the series which owns the selected point.
- PySide6.QtDataVisualization.Q3DSurface.selectedSeriesChanged(series)
- Parameters
- PySide6.QtDataVisualization.Q3DSurface.seriesList()
- Return type
Returns the list of series added to this graph.
- PySide6.QtDataVisualization.Q3DSurface.setAxisX(axis)
- Parameters
This property holds The active x-axis..
- PySide6.QtDataVisualization.Q3DSurface.setAxisY(axis)
- Parameters
This property holds The active y-axis..
- PySide6.QtDataVisualization.Q3DSurface.setAxisZ(axis)
- Parameters
This property holds The active z-axis..
- PySide6.QtDataVisualization.Q3DSurface.setFlipHorizontalGrid(flip)
- Parameters
flip – bool
This property holds Whether the horizontal axis grid is displayed on top of the graph rather than on the bottom..
In some use cases the horizontal axis grid is mostly covered by the surface, so it can be more useful to display the horizontal axis grid on top of the graph rather than on the bottom. A typical use case for this is showing 2D spectrograms using orthoGraphic projection with a top-down viewpoint.
If false, the horizontal axis grid and labels are drawn on the horizontal background of the graph. If true, the horizontal axis grid and labels are drawn on the opposite side of the graph from the horizontal background. Defaults to false.
© 2022 The Qt Company Ltd. Documentation contributions included herein are the copyrights of their respective owners. The documentation provided herein is licensed under the terms of the GNU Free Documentation License version 1.3 as published by the Free Software Foundation. Qt and respective logos are trademarks of The Qt Company Ltd. in Finland and/or other countries worldwide. All other trademarks are property of their respective owners.