
7.2.4. Visualization Framework
Allows for writing reusable visualization modules that can be invoked by the Axivion Dashboard for the ability of displaying Custom Visualizations inside the Dashboard Page.
Related modules
Main Module of the Dashboard Visualization API. |
|
Outputters of the Dashboard Visualization API. |
7.2.4.4. Getting started
A valid visualization module must define the factory method
create_visualization_writer(report_runner)
returning an instance of an implementation of the interface
VisualizationWriter and the python file must match the pattern
visualization_*.py.
Currently a minimal valid visualization module could look like this:
# Copyright (C) 2025 Axivion GmbH
# Copyright (C) 2025 The Qt Company GmbH, a subsidiary of The Qt Group
# https://www.qt.io


from typing import Tuple

from axivion.dashboard.report import Option, ReportRunner
from axivion.dashboard.visualization import (
    VisualizationApiVersion,
    VisualizationContext,
    VisualizationWriter,
)


def create_visualization_writer(_runner: ReportRunner) -> VisualizationWriter:
    '''Factory method called by the visualization framework module loader'''
    return MyVisualizationWriter()


class MyVisualizationWriter(VisualizationWriter):
    def visualization_api_version(self) -> VisualizationApiVersion:
        return VisualizationApiVersion(1, 0)

    def get_description(self) -> str:
        return "A simple example visualization script"

    def get_options(self) -> Tuple[Option, ...]:
        return (
            Option.text(
                name="example", default="Hello World!", description="an example option"
            ),
        )

    def write_visualization(self, context: VisualizationContext) -> None:
        with context.output().plain_text() as pt:
            pt.write(context.get_option_value('example'))
Of course in order for this to do something useful, in the
VisualizationWriter.write_visualization() method you will want to make use of the
axivion.dashboard.Project instance supplied via Context.get_project()
in order to fetch the metric values or issue lists you are interested in for your
visualization.
In order to get going you most probably want to read the
Custom Visualizations chapter and configure an
example script on your Dashboard that you later can modify and reload the page
to try new code. In case of an error you should be able to see the output of your
visualization script in the Dashboard. You may want to set the Dashboard’s
Log Level to debug so as
to get more detailed output in case of errors.
7.2.4.5. Visualization types
The Output object returned by
VisualizationContext.output() produces a single
visualization. The available visualization types are shown below, each
with a minimal example. All snippets are meant to replace the body of
the VisualizationWriter.write_visualization() method in the
minimal module shown above;
the context parameter is the supplied
VisualizationContext.
In practice, you would fetch the values to be displayed from the
axivion.dashboard.Project instance returned by
Context.get_project() rather than hard-coding them.
Plain text
Output.plain_text() outputs unformatted text. Special
characters are escaped for you, so the text is rendered verbatim.
with context.output().plain_text() as pt:
    pt.write("42 open issues, 3 new since the last run.")
Markdown
Output.markdown() renders a CommonMark string. Images are not supported.
with context.output().markdown() as md:
    md.write("# Issue summary\n\n")
    md.write("- **Total:** 42\n")
    md.write("- **New since last run:** 3\n")
SVG
Output.svg() embeds a complete SVG document. If the document
declares an encoding, it has to be UTF-8. The SVG is embedded
inline into the page, so an <?xml?> prolog or a <!DOCTYPE>
declaration is not needed; the bare <svg> element is sufficient.

with context.output().svg() as svg:
    svg.write_xml(
        '<svg xmlns="http://www.w3.org/2000/svg"'
        ' width="200" height="200" viewBox="0 0 467 462">'
        '<rect x="80" y="60" width="250" height="250" rx="20"'
        ' style="fill:#ff0000; stroke:#000000; stroke-width:2px;" />'
        '<rect x="140" y="120" width="250" height="250" rx="40"'
        ' style="fill:#0000ff; stroke:#000000; stroke-width:2px;'
        ' fill-opacity:0.7;" />'
        '</svg>'
    )
Vega
Output.vega() renders a Vega
or Vega-Lite
specification. The specification is passed as a JSON string, so it is
convenient to build it as a dict and serialize it with
json.dumps().
import json

spec = {
    "$schema": "https://vega.github.io/schema/vega-lite/v6.json",
    "description": "Issues per severity.",
    "width": 600,
    "data": {
        "values": [
            {"severity": "Error", "count": 12},
            {"severity": "Warning", "count": 30},
            {"severity": "Info", "count": 5},
        ]
    },
    "mark": "bar",
    "encoding": {
        "x": {"field": "severity", "type": "nominal"},
        "y": {"field": "count", "type": "quantitative"},
    },
}

with context.output().vega() as vega:
    vega.write_json(json.dumps(spec))
For more elaborate Vega visualizations see the example scripts below.
Note
Vega event streams with the window: source (for example
"window:mousemove") are fully supported. When Dashboard pages
are embedded by the IDE plugins, such events only occur within the
embedded page area, as the surrounding IDE does not forward its own
events. Interactions that should not depend on the embedding
context are better expressed with view:-scoped event streams.
Table
Output.table() outputs tabular data. The columns are described
first via Table.columns(), then the row data is supplied via
Table.rows(). Cells can link to other Dashboard pages by
referencing a linkKey column.
project = context.get_project()

with context.output().table() as table:
    table.columns(
        [
            {
                "key": "rule",
                "type": "string",
                "canSort": True,
                "width": 0.7,
            },
            {
                "key": "count",
                "type": "number",
                "canSort": True,
                "alignment": "right",
                "width": 0.3,
                "linkKey": "url",
            },
        ]
    )
    table.rows(
        [
            {
                "rule": rule,
                "count": count,
                "url": project.create_issue_table_url(
                    "SV", column_filters={"errorNumber": f'"{rule}"'}
                ),
            }
            for rule, count in (("MisraC2012-1.1", 7), ("MisraC2012-2.3", 2))
        ]
    )
Grid
Output.grid() arranges several outputs in a grid with a fixed
number of columns. It is the way to show more than one output at
once, since the root Output accepts only a single
child. Each child can be given an optional style mapping of CSS
properties, e.g., to let a cell span multiple columns. Grids may be
nested.
with context.output().grid(columns=2) as grid:
    with grid.plain_text() as pt:
        pt.write("Left cell")
    with grid.markdown() as md:
        md.write("**Right cell**")
    with grid.plain_text(style={"grid-column-end": "span 2"}) as pt:
        pt.write("This cell spans both columns")
7.2.4.6. Relation to the Reporting Framework
The Visualization Framework is closely related to the
Reporting Framework and
there are a lot of aspects they have in common. Among them
is the executability via the Report Runner although in the
visualization case it is less likely that you want to make use of that.
Multi value options and
Local library inclusion are two identical
aspects of the frameworks.
7.2.4.7. More advanced examples
Various example visualization scripts are provided in the examples/reports
sub-directory which can be found in the Axivion Suite installation directory.
Find below explanations for some of them.
visualization_misra_autosar_report.py
A compliance report that works well with Misra/Autosar.
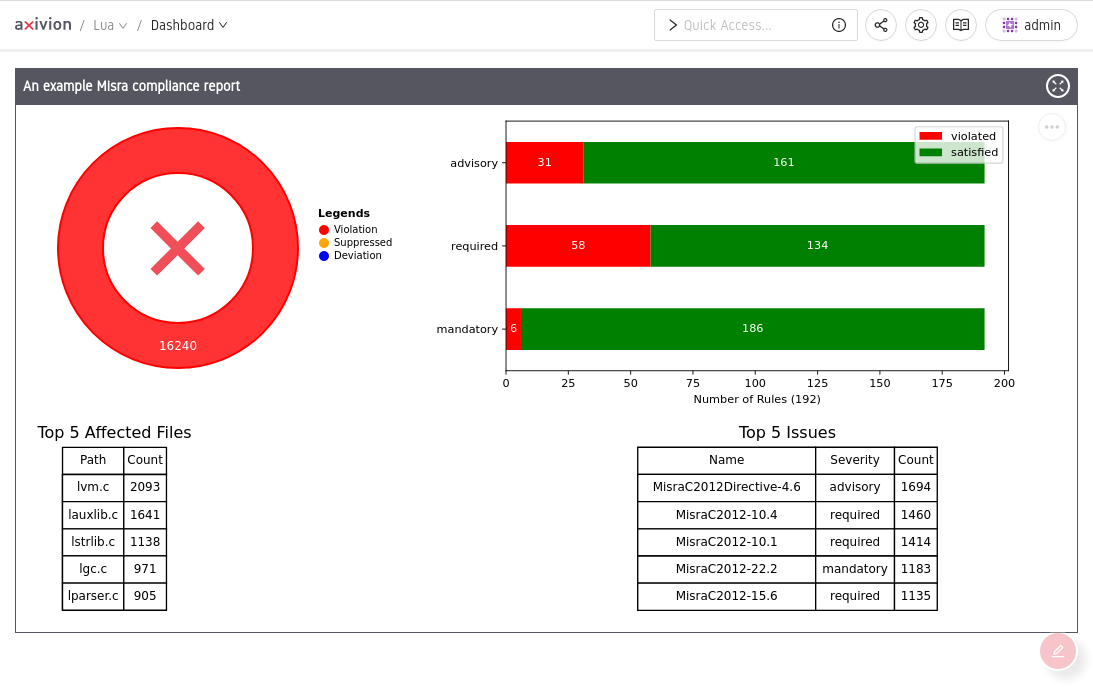
A Dashboard page configured to show a Misra compliance report
visualization_style_violations_donut.py
Plots the number of style violations matching a given ErrorNumber filter as a two-level donut chart grouped by ErrorNumber and Severity.
visualization_treemap.py
Visualizes the file hierarchy as a Treemap with a Heatmap overlay.
visualization_hierarchical_edge_bundles.py
Visualizes cycles between files with hierarchical edge bundles.
visualization_issue_count_grouped_by_rule.py
Groups issues by rule name and displays them in a table with expandable rows.