
5.1.4.3. Diving into a Project
One way to explore a project is the Projects Menu
in the
top left corner of the Navigation Area.
The Project Menu has an entry for every configured project that the current
user has access to.
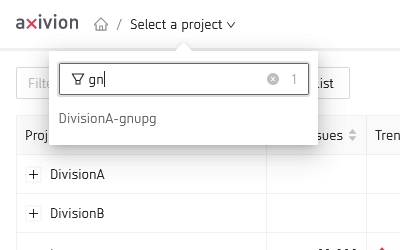
The partially filtered Projects menu.
Once a project is selected, the Navigation Area reveals the Project Pages Menu giving access to various project specific pages. Some of the entries in it might not be visible depending on your permissions.
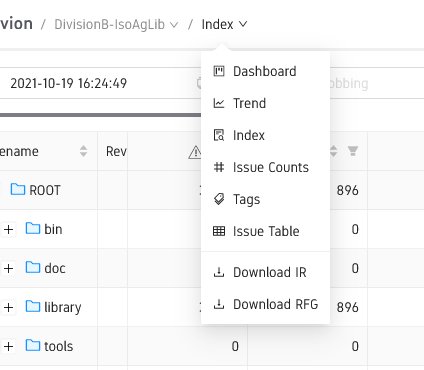
The project pages menu
The available entries are:
- Dashboard
The main page of every project.
- Index
A file browser for browsing project specific files.
- Trend
A page dedicated to the development over time resp. Graphical Analysis of the project using various metrics.
- Issue Counts
A different view for looking at the development over time of issue counts.
- Tags
Allows those having the permissions to manage issue tags available in the project.
- Issue Table
The Issue Table that can show the detailed list of issues in a version or the differences between two versions.
- Download IR
Allows downloading the latest IR
- Download RFG
Allows downloading the latest RFG
- Generate Report
Allows generating a report for the current project
Dashboard Page
The default project page is the Dashboard. It gives more detailed insight on the analysis results of a specific project as well as trends and allows access to further project specific aspects.
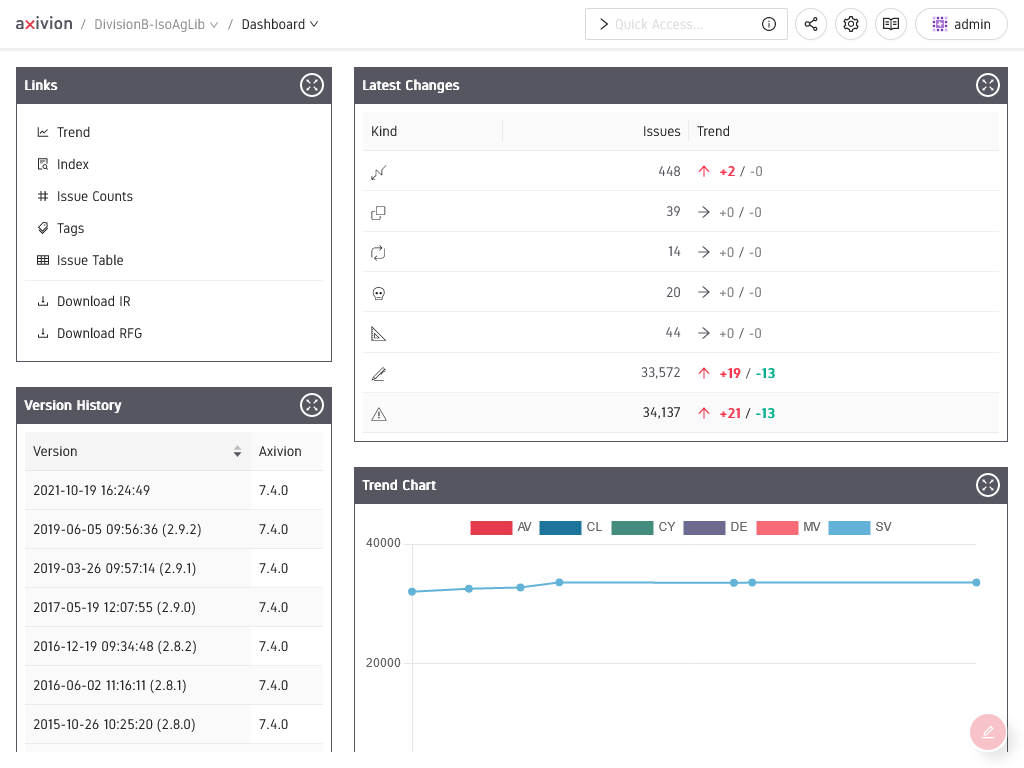
The Dashboard page in its default layout
The Dashboard page consists of several gadgets that can be rearranged and configured
by holders of the Manage Portal
permission using the button in the
lower right corner.
There are several available gadget types:
- Links
Gives access to Issue Counts, Trend, Index and allows downloading the latest IR and RFG file if the analysis was configured (IR, RFG) to preserve them. It also offers an option to create a report from the current project.
- Version History
Provides a list of the existing project versions that were analyzed.
- Latest Changes
Gives a quick, per issue kind overview of the differences between the last two analyzed versions.
- Trend Chart
Shows the development of the absolute, per issue kind issue counts. The individual issue kinds can be deactivated to optimize the y-axis for the display of the remaining plot curves.
- Custom Visualization
Allows for Python Visualization scripts to be included in order to render custom content derived by querying the Python Dashboard API.
Trend Page
The Trend displays charts containing the development of metric values over time. The basic selection of available metrics is configured globally by the dashboard administrator.
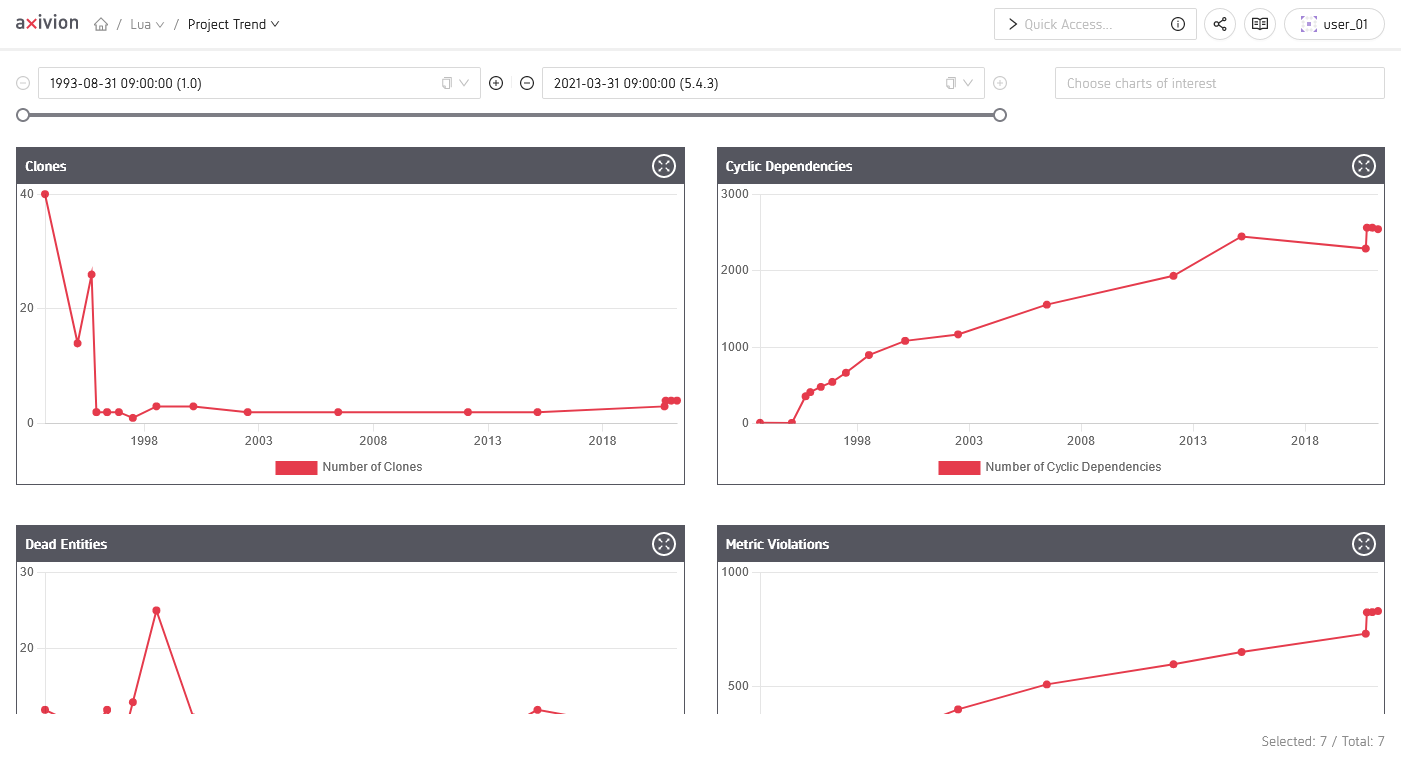
The Trend Page.
You can choose to see only a subset of these charts by selecting them in the filter panel next to the version range selector where you can reduce the range of versions to display.
Issue Counts
The Issue Counts view summarizes the change in the erosion issue count: How many erosion issues are new and how many have been resolved. This is quite similar to what is available in the Overview tooltips. However, one can choose the version range as well as restrict the information to a specific user.
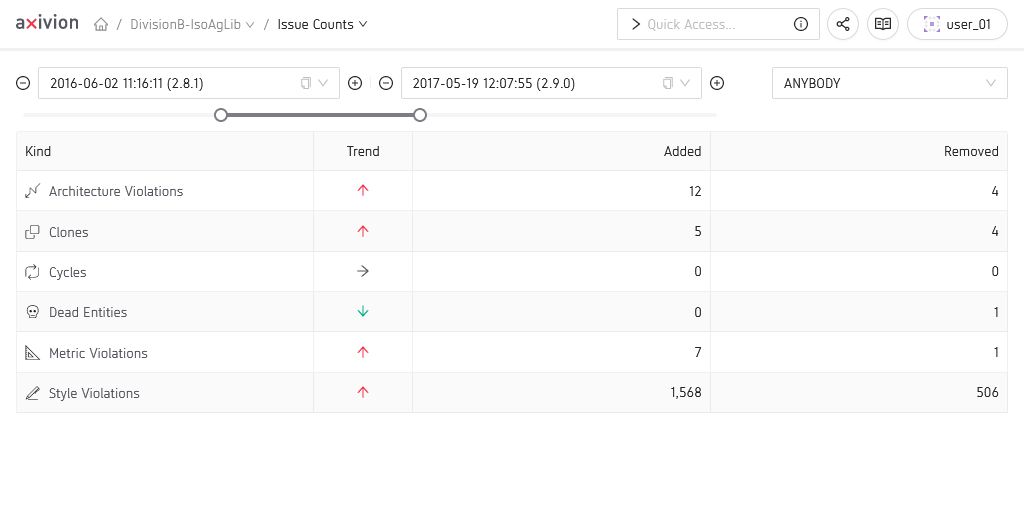
Change in erosion issues for a project shown in a Issue Counts View.