
5.1.2.7. Custom Visualizations
Project erosion data can be displayed on the Dashboard Page in different visualization formats—graphs, charts, tables, images, etc.—by creating custom scripts that fetch and process the relevant data from the Dashboard API.
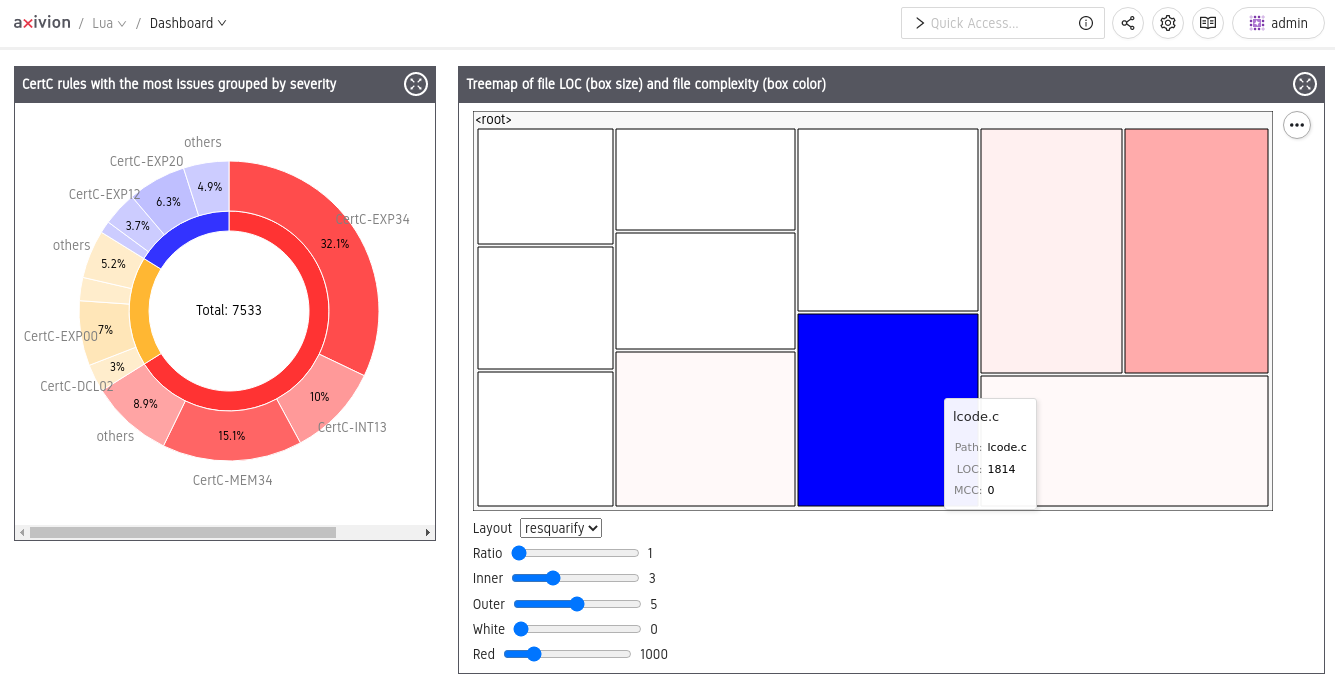
Dashboard page with custom visualizations.
Caution
Depending on the amount of data processed by visualization scripts, this feature may place noticeable load on the server; that said, visualization results are cached between page loads to maintain server responsiveness. Furthermore, if the generated visualizations contain lots of data that need to be processed on the client side—e.g., complex SVG graphics with many shapes and paths—the browser performance may degrade on the Dashboard Page.
To add custom visualizations, the Visualization Creation Interface must be enabled and configured.
Note
Starting with 7.11, the Visualization Creation Interface is enabled by default for newly created Axivion Dashboard Server configurations, with the module search path set to <confdir>/modules. Additionally, this directory is populated with a set of example scripts.
In order for a user to customize the project portal on the
Dashboard Page, they must be
granted the Manage Portal
permission. Additionally,
the Generate Reports
permission is
required to add Custom Visualization
Gadgets.
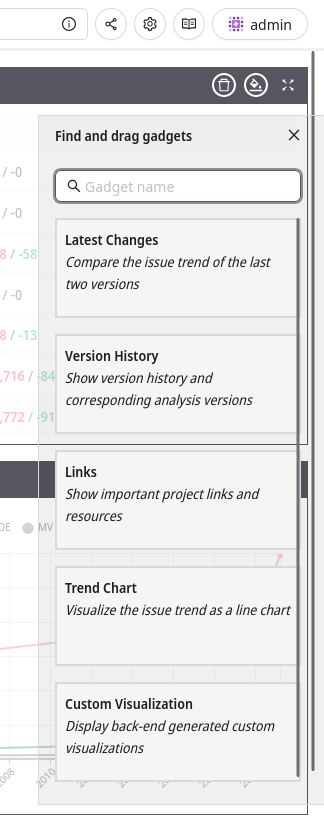
Visualizations can be added to the project portal via Custom Visualization gadgets (cf. Section 5.1.4.3).
Similar to Custom Report Scripts, visualization scripts support configurable parameters that can be set through the UI and that are stored along with the gadget. After portal configuration is complete, all users will see the same gadgets for all projects, i.e., there exists only one portal configuration and regular users won’t be able to change it.
More details on creating new report modules can be found in Section 7.2.4.