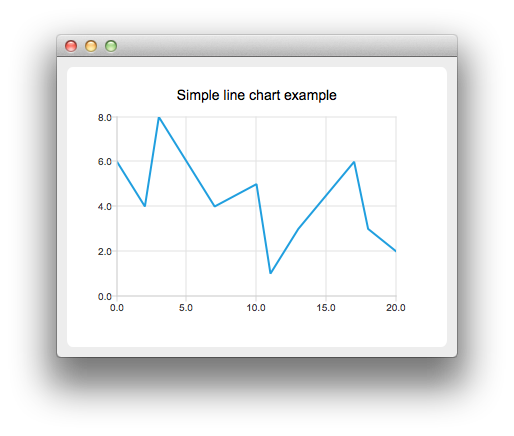
折れ線グラフの作成
注: これはCharts with Widgets Galleryの例の一部です。

折れ線グラフを作成するには、QLineSeries インスタンスが必要です。作成しましょう。
auto series = new QLineSeries;
次に、系列にデータを追加します。append()メンバ関数を使用するか、ストリーム演算子を使用します。
series->append(0, 6);
series->append(2, 4);
series->append(3, 8);
series->append(7, 4);
series->append(10, 5);
*series << QPointF(11, 1) << QPointF(13, 3) << QPointF(17, 6) << QPointF(18, 3) << QPointF(20, 2);
チャート上にデータを表示するには、QChart インスタンスが必要です。このインスタンスに系列を追加し、デフォルトの軸を作成し、チャートのタイトルを設定します。
auto chart = new QChart;
chart->legend()->hide();
chart->addSeries(series);
chart->createDefaultAxes();
chart->setTitle("Simple Line Chart");
そして、QChart をパラメータとしてQChartView オブジェクトを作成します。こうすることで、QGraphicsView シーンを作成する必要がなくなる。
createDefaultChartView(chart);
これでチャートを表示する準備ができました。
© 2025 The Qt Company Ltd. Documentation contributions included herein are the copyrights of their respective owners. The documentation provided herein is licensed under the terms of the GNU Free Documentation License version 1.3 as published by the Free Software Foundation. Qt and respective logos are trademarks of The Qt Company Ltd. in Finland and/or other countries worldwide. All other trademarks are property of their respective owners.

