簡単な棒グラフ
QMLアプリケーションでBars3D 。
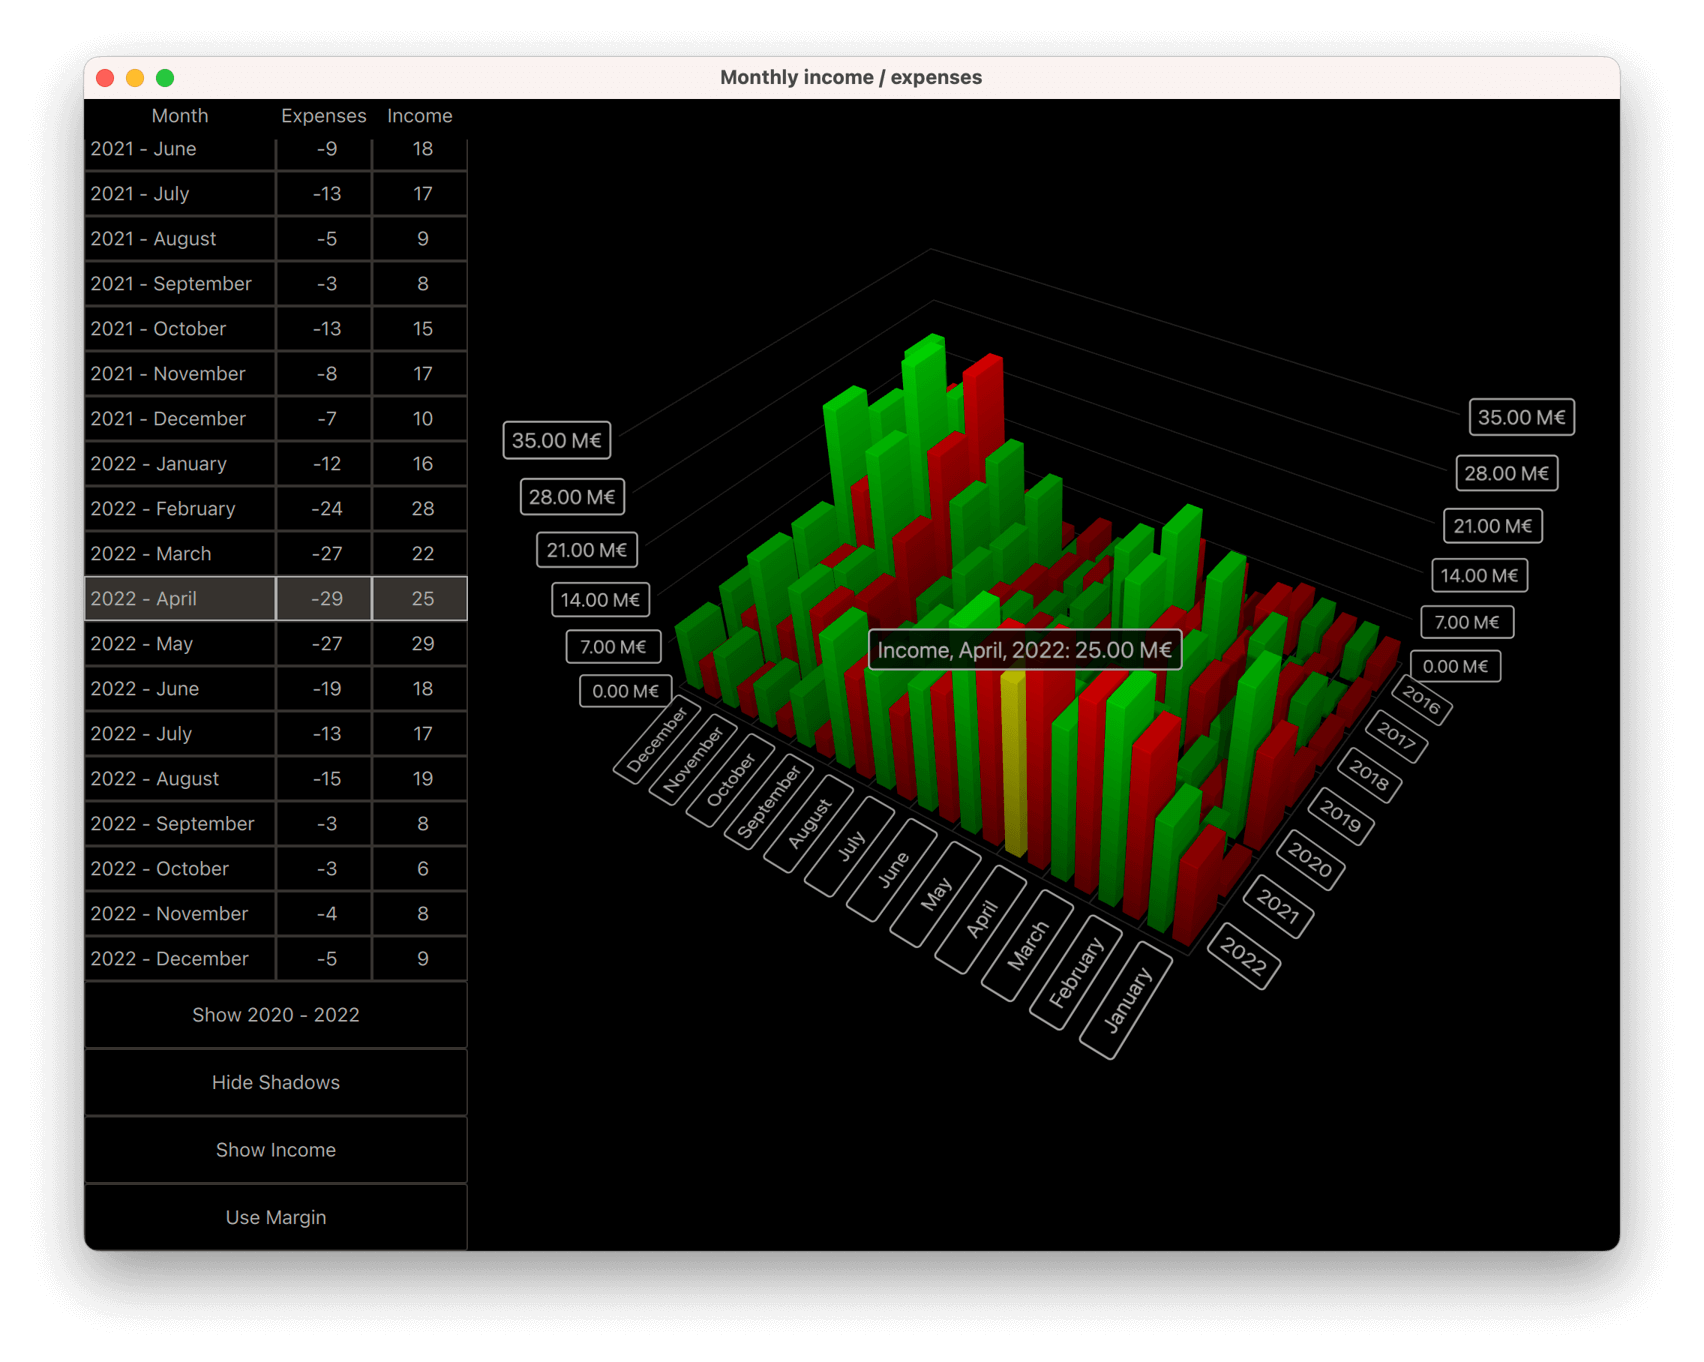
Simple Bar Graphでは、Bars3D と QML を使ってシンプルな 3D 棒グラフを作る方法を紹介しています。
次のセクションでは、系列を切り替えたり、一度に複数の系列を表示する方法について説明します。QMLアプリケーションの基本的な機能については、単純散布図を参照してください。
例を実行する
から例を実行するには Qt Creatorからサンプルを実行するには、Welcome モードを開き、Examples からサンプルを選択します。詳細については、Qt Creator:Tutorialを参照してください:ビルドと実行。
データ
例のデータ集合は、架空の会社の数年間の月次収入と支出です。データは、Data.qml のリスト・モデルで次のように定義されています:
ListModel {
    id: dataModel
    ListElement{ timestamp: "2016-01"; expenses: "-4";  income: "5" }
    ListElement{ timestamp: "2016-02"; expenses: "-5";  income: "6" }
    ListElement{ timestamp: "2016-03"; expenses: "-7";  income: "4" }
    ...
各データ項目には、タイムスタンプ、収入、支出の3つの役割があります。タイムスタンプの値は、<four digit year>-<two digit month> の形式です。通常は、年月を棒グラフの行と列に対応させますが、値としては収入か支出のどちらかしか表示できません。
次に、Bars3D グラフにデータを追加する。その中にBar3DSeries を2つ作成し、収入の系列から始めます:
Bar3DSeries {
    id: barSeries
    itemLabelFormat: "Income, @colLabel, @rowLabel: @valueLabel"
    baseGradient: barGradient

    ItemModelBarDataProxy {
        id: modelProxy
        itemModel: graphData.model
        rowRole: "timestamp"
        columnRole: "timestamp"
        valueRole: "income"
        rowRolePattern: /^(\d\d\d\d).*$/
        columnRolePattern: /^.*-(\d\d)$/
        rowRoleReplace: "\\1"
        columnRoleReplace: "\\1"
        multiMatchBehavior: ItemModelBarDataProxy.MMBCumulative
    }
    ...
データは、系列内のItemModelBarDataProxy のitemModel プロパティに添付します。valueRole にはincome フィールドを指定する。年と月は同じフィールドにあるので、取得は少し複雑です。これらの値を抽出するには、rowRole とcolumnRole の両方にtimestamp フィールドを指定し、さらにこれらのロールに検索パターンと置換ルールを指定して、各ロールのフィールド内容の正しい部分を抽出します。検索パターンは通常のJavaScript正規表現であり、置換ルールは正規表現にマッチしたフィールド内容を何に置き換えるかを指定します。この場合、フィールドの内容全体を、行と列の両方で最初にキャプチャされた部分文字列である年または月だけに置き換えます。正規表現による置換機能の詳細については、QString::replace(const QRegExp &rx, constQString &after)関数のドキュメントを参照してください。
multiMatchBehavior プロパティは、複数のアイテムモデル項目が同じ行/列の組み合わせにマッチする場合の処理を指定します。この場合、それらの値を加算します。このプロパティは、各月の値を表示するときには何の影響も及ぼしません。
次に、支出のために別の系列を追加します:
Bar3DSeries {
    id: secondarySeries
    visible: false
    itemLabelFormat: "Expenses, @colLabel, @rowLabel: -@valueLabel"
    baseGradient: secondaryGradient

    ItemModelBarDataProxy {
        id: secondaryProxy
        itemModel: graphData.model
        rowRole: "timestamp"
        columnRole: "timestamp"
        valueRole: "expenses"
        rowRolePattern: /^(\d\d\d\d).*$/
        columnRolePattern: /^.*-(\d\d)$/
        valueRolePattern: /-/
        rowRoleReplace: "\\1"
        columnRoleReplace: "\\1"
        multiMatchBehavior: ItemModelBarDataProxy.MMBCumulative
    }
    ...
このモデルには、支出は負の値として含まれていますが、収入の棒グラフと簡単に比較できるように、正の棒グラフとして表示したいのです。これを実現するには、valueRolePattern を使ってマイナス記号を削除します。デフォルトの置換は空文字列なので、置換文字列を指定する必要はありません。
系列のvisible プロパティを使って、とりあえず2番目の系列を非表示にする。
カスタム軸ラベル
Axes.qml は、列軸のカテゴリ・ラベルを再定義します。データには月の数字が含まれているため、ラベルが乱雑になるからです:
CategoryAxis3D {
    id: columnAxis
    labels: ["January", "February", "March", "April", "May", "June",
        "July", "August", "September", "October", "November", "December"]
    labelAutoRotation: 30
}
軸ラベルを低いカメラ・アングルでも読みやすくするには、軸ラベルの自動回転を設定します。
系列の切り替え
main.qml で、グラフとさまざまなUI要素を設定する。ここには3つの興味深いコードブロックがある。最初のものは、2つの系列の可視性を変更するだけで、収入、支出、およびその両方の間で視覚化されたデータを変更する方法を示しています:
onClicked: {
    if (text === "Show Expenses") {
        barSeries.visible = false;
        secondarySeries.visible = true;
        barGraph.valueAxis.labelFormat = "-%.2f M\u20AC";
        secondarySeries.itemLabelFormat = "Expenses, @colLabel, @rowLabel: @valueLabel";
        text = "Show Both";
    } else if (text === "Show Both") {
        barSeries.visible = true;
        barGraph.valueAxis.labelFormat = "%.2f M\u20AC";
        secondarySeries.itemLabelFormat = "Expenses, @colLabel, @rowLabel: -@valueLabel";
        text = "Show Income";
    } else { // text === "Show Income"
        secondarySeries.visible = false;
        text = "Show Expenses";
    }
}
軸ラベル・フォーマットと項目選択ラベル・フォーマットを微調整して、実際には正の値として解決されていた支出について、負の符号を正しく表示するようにしています。
2番目の興味深いブロックは、プロキシのプロパティを調整することによって、可視化されたデータが変更されるところです:
onClicked: {
    if (text === "Show yearly totals") {
        modelProxy.autoRowCategories = true;
        secondaryProxy.autoRowCategories = true;
        modelProxy.columnRolePattern = /^.*$/;
        secondaryProxy.columnRolePattern = /^.*$/;
        graphAxes.value.autoAdjustRange = true;
        barGraph.columnAxis = graphAxes.total;
        text = "Show all years";
    } else if (text === "Show all years") {
        modelProxy.autoRowCategories = true;
        secondaryProxy.autoRowCategories = true;
        modelProxy.columnRolePattern = /^.*-(\d\d)$/;
        secondaryProxy.columnRolePattern = /^.*-(\d\d)$/;
        graphAxes.value.min = 0;
        graphAxes.value.max = 35;
        barGraph.columnAxis = graphAxes.column;
        text = "Show 2020 - 2022";
    } else { // text === "Show 2020 - 2022"
        // Explicitly defining row categories, since we do not want to show data for
        // all years in the model, just for the selected ones.
        modelProxy.autoRowCategories = false;
        secondaryProxy.autoRowCategories = false;
        modelProxy.rowCategories = ["2020", "2021", "2022"];
        secondaryProxy.rowCategories = ["2020", "2021", "2022"];
        text = "Show yearly totals";
    }
}
年間合計を表示するには、各年の12ヶ月を1本のバーにまとめます。これは、すべてのモデル項目にマッチするcolumnRolePattern 。そうすることで、データプロキシは1つの列だけを持つようになる。先ほどプロキシに指定した累積multiMatchBehavior が意味を持つようになり、各年のすべての12ヶ月の値が合計されて1本の棒になる。
年のサブセットだけを表示するには、ItemModelBarDataProxy 項目でautoRowCategories をfalseに設定し、行のカテゴリーを明示的に定義する。こうすると、指定された行カテゴリーの項目だけが表示されます。
3番目の興味深いブロックは、ItemModelBarDataProxy メソッドrowCategoryIndex() とcolumnCategoryIndex() を使って、行と列の値がわかっている場合に、項目の行と列のインデックスを取得する方法を示しています:
onCurrentRowChanged: {
    var timestamp = graphData.model.get(mainview.currentRow).timestamp;
    var pattern = /(\d\d\d\d)-(\d\d)/;
    var matches = pattern.exec(timestamp);
    var rowIndex = modelProxy.rowCategoryIndex(matches[1]);
    var colIndex;
    if (barGraph.columnAxis == graphAxes.total)
        colIndex = 0 ;// Just one column when showing yearly totals
    else
        colIndex = modelProxy.columnCategoryIndex(matches[2]);
    if (selectedSeries.visible)
        mainview.selectedSeries.selectedBar = Qt.point(rowIndex, colIndex);
    else if (barSeries.visible)
        barSeries.selectedBar = Qt.point(rowIndex, colIndex);
    else
        secondarySeries.selectedBar = Qt.point(rowIndex, colIndex);
}
© 2026 The Qt Company Ltd. Documentation contributions included herein are the copyrights of their respective owners. The documentation provided herein is licensed under the terms of the GNU Free Documentation License version 1.3 as published by the Free Software Foundation. Qt and respective logos are trademarks of The Qt Company Ltd. in Finland and/or other countries worldwide. All other trademarks are property of their respective owners.
