
シンプルな散布図
QMLアプリケーションでのScatter3Dの使用方法。
「シンプルな散布図」では、Scatter3DとQMLを使用してシンプルな散布図の可視化を作成する方法を紹介します。
グラフの操作方法については、こちらのページをご覧ください。
独自の新しいQt Quick アプリケーションを作成する方法については、Qt Creator のヘルプを参照してください。
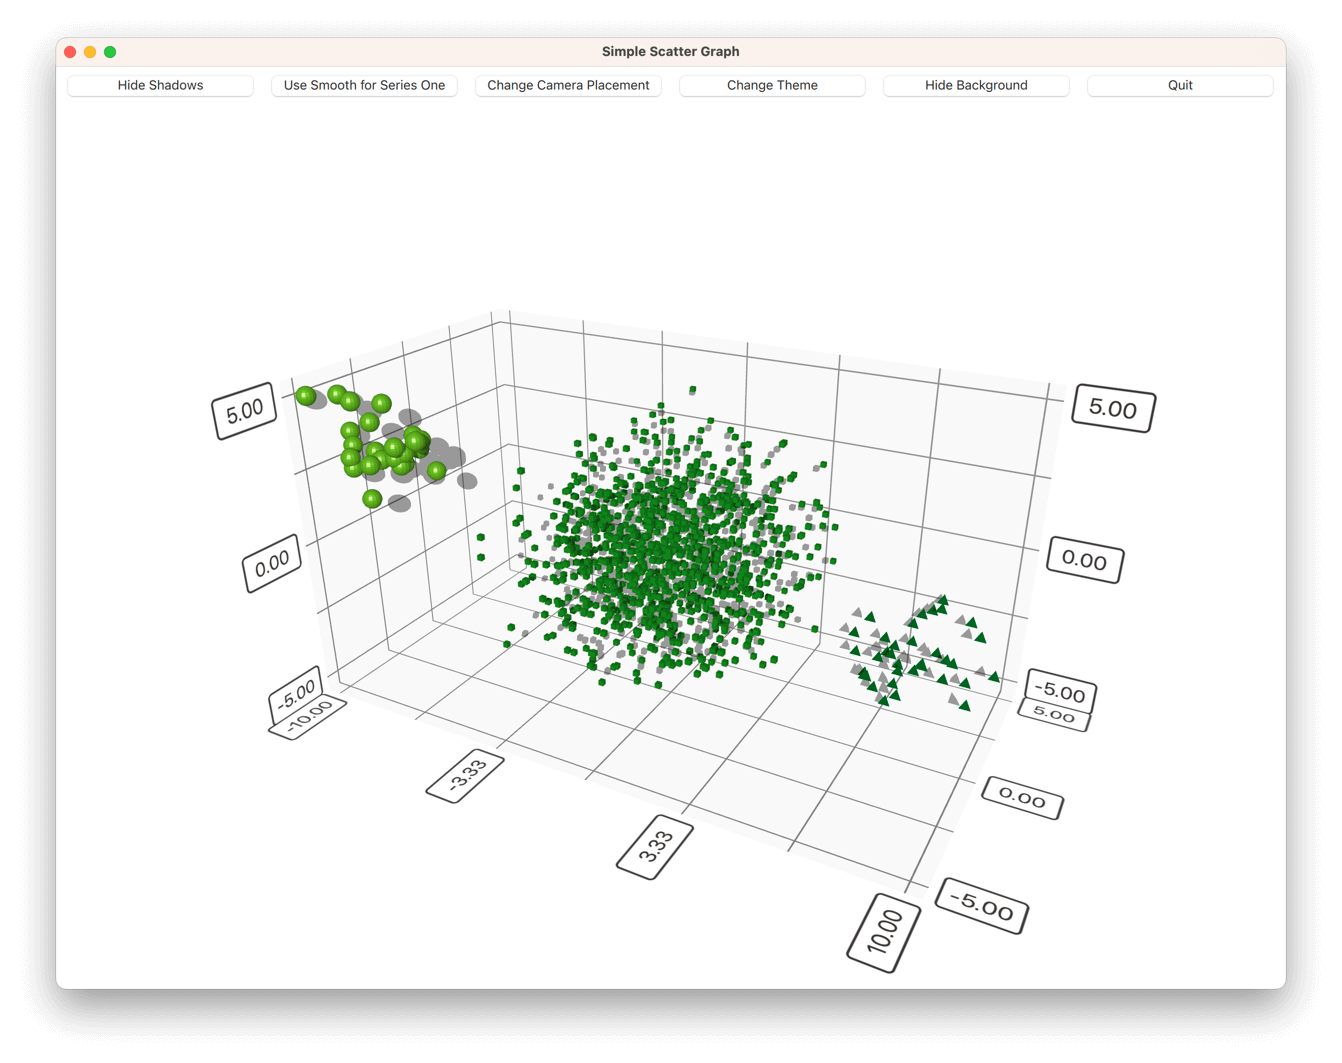
例の動作確認
以下の手順でサンプルを実行できます。
- Qt Creator
Welcome モードを開き、Examples からこの例を選択してください。詳細については、Qt Creator の「チュートリアル:ビルドと実行」を参照してください。
- Qt Extension for Visual Studio Code
Command Palette から `Qt: Open Qt examples ` コマンドを実行し、リストからサンプルを選択します。詳細については、Qt Extension for Visual Studio Code: Tutorial: Build and run を参照してください。
アプリケーションの基礎
QML コードを詳しく調べる前に、アプリケーションmain.cpp を確認してください。
このアプリケーションでは、UI に「Quit」ボタンが実装されているため、QQmlEngine::quit() シグナルをアプリケーションのQWindow::close() スロットに接続する必要があります。
QObject::connect(viewer.engine(), &QQmlEngine::quit, &viewer, &QWindow::close);デプロイを少し簡単にするために、アプリケーションのすべての.qml ファイルをリソースファイル (qmlscatter.qrc) にまとめます:
<RCC>
    <qresource prefix="/">
        <file>qml/qmlscatter/Data.qml</file>
        <file>qml/qmlscatter/main.qml</file>
    </qresource>
</RCC>これには、リソース(qrc: )からmain.qml を読み込むように設定することも必要です:
viewer.setSource(QUrl("qrc:/qml/qmlscatter/main.qml"));qmakeの代わりにcmakeを使用する場合は、.qml ファイルをCMakeLists.txt 内のQMLモジュールに追加します:
qt6_add_qml_module(qmlscatter
    URI Scatter
    VERSION 1.0
    NO_RESOURCE_TARGET_PATH
    QML_FILES
        qml/qmlscatter/Data.qml
        qml/qmlscatter/main.qml
)
最後に、アプリケーションを最大化されたウィンドウで実行するように設定します:
viewer.showMaximized();グラフの設定
まず、必要なすべての QML モジュールをインポートします:
import QtQuick
import QtQuick.Controls
import QtDataVisualization次に、メインのItem を作成し、mainView という名前を付けます:
Item {
    id: mainView
次に、メインの `Item` 内に別の `Item ` を追加し、`dataView` と名付けます。これが Scatter3D グラフを格納するアイテムになります。親の底部(bottom)にアンカーを設定します:
Item {
    id: dataView
anchors.bottom: parent.bottom次に、Scatter3Dグラフ自体を追加します。dataView 内に追加し、scatterGraph という名前を付けます。dataView 全体を埋めるように設定します:
Scatter3D {
    id: scatterGraph
    anchors.fill: parent
これでグラフは使用可能な状態になりましたが、データはまだありません。また、デフォルトの軸と視覚的なプロパティが設定されています。
次に、scatterGraph 内に以下を追加して、まずいくつかの視覚的プロパティを変更します:
theme: themeQt
shadowQuality: AbstractGraph3D.ShadowQualityHigh
scene.activeCamera.cameraPreset: Camera3D.CameraPresetFront
カスタマイズされたテーマが追加され、影の質感が変更され、カメラの位置が調整されました。その他の視覚的プロパティは問題ないので、変更する必要はありません。
カスタムテーマは、定義済みのテーマ「Theme3D.ThemeQt 」をベースにしていますが、その中のフォントが変更されています:
Theme3D {
    id: themeQt
    type: Theme3D.ThemeQt
    font.pointSize: 40
}
次に、グラフにデータを投入し始めます。
グラフへのデータの追加
mainView 内に「Data 」アイテムを作成し、「seriesData 」という名前を付けます:
Data {
    id: seriesData
}この「seriesData 」アイテムには、この例で使用される3つの系列すべてのデータモデルが含まれています。
これは、Data.qml 内のデータを保持するコンポーネントです。メインコンポーネントとしてItem を持っています。
メインコンポーネント内で、データ自体を「ListModel 」に追加し、「dataModel 」という名前を付けます:
ListModel {
    id: dataModel
    ListElement{ xPos: -10.0; yPos: 5.0; zPos: -5.0 }
...残りの2つのシリーズに対しても同様の操作を行い、それぞれを「dataModelTwo 」および「dataModelThree 」と名付けます。
次に、main.qml から利用できるようにデータモデルを公開します。これを行うには、メインのデータコンポーネント内でそれらをエイリアスとして定義します:
property alias model: dataModel
property alias modelTwo: dataModelTwo
property alias modelThree: dataModelThreeこれで、main.qml 内で、Data.qml のデータをscatterGraph と共に使用できるようになります。まず、Scatter3DSeriesを追加し、scatterSeries という名前を付けます:
Scatter3DSeries {
    id: scatterSeries
次に、そのシリーズ用の選択ラベルの書式を設定します:
itemLabelFormat: "Series 1: X:@xLabel Y:@yLabel Z:@zLabel"最後に、ItemModelScatterDataProxyにシリーズ1のデータを追加します。プロキシのitemModel としてデータ自体を設定します:
ItemModelScatterDataProxy {
    itemModel: seriesData.model
    xPosRole: "xPos"
    yPosRole: "yPos"
    zPosRole: "zPos"
}
他の2つのシリーズも同様の方法で追加しますが、シリーズ固有の詳細を少し変更します:
Scatter3DSeries {
    id: scatterSeriesTwo
    itemLabelFormat: "Series 2: X:@xLabel Y:@yLabel Z:@zLabel"
    itemSize: 0.05
    mesh: Abstract3DSeries.MeshCube
...次に、scatterGraph 内のデフォルトの軸のプロパティを少し変更します:
axisX.segmentCount: 3
axisX.subSegmentCount: 2
axisX.labelFormat: "%.2f"
axisZ.segmentCount: 2
axisZ.subSegmentCount: 2
axisZ.labelFormat: "%.2f"
axisY.segmentCount: 2
axisY.subSegmentCount: 2
axisY.labelFormat: "%.2f"その後、グラフを操作するためのボタンをmainView にいくつか追加します。その一例を以下に示します:
Button {
    id: shadowToggle
    width: mainView.buttonWidth // Calculated elsewhere based on screen orientation
    anchors.left: parent.left
    anchors.top: parent.top
    anchors.margins: 5
    text: scatterGraph.shadowsSupported ? "Hide Shadows" : "Shadows not supported"
    enabled: scatterGraph.shadowsSupported
    onClicked: {
        if (scatterGraph.shadowQuality === AbstractGraph3D.ShadowQualityNone) {
            scatterGraph.shadowQuality = AbstractGraph3D.ShadowQualityHigh;
            text = "Hide Shadows";
        } else {
            scatterGraph.shadowQuality = AbstractGraph3D.ShadowQualityNone;
            text = "Show Shadows";
        }
    }
}次に、dataView を修正して、上部にボタンを配置するスペースを確保します:
Item {
    id: dataView
    anchors.bottom: parent.bottom
    width: parent.width
    // Adjust the space based on screen orientation:
    // If we're in portrait mode, we have 3 rows of buttons, otherwise they are all in one row.
    height: parent.height - (mainView.portraitMode ? shadowToggle.implicitHeight * 3 + 25
                                                   : shadowToggle.implicitHeight + 10)
    ...
これで完了です!
例の概要
© 2026 The Qt Company Ltd. Documentation contributions included herein are the copyrights of their respective owners. The documentation provided herein is licensed under the terms of the GNU Free Documentation License version 1.3 as published by the Free Software Foundation. Qt and respective logos are trademarks of The Qt Company Ltd. in Finland and/or other countries worldwide. All other trademarks are property of their respective owners.
