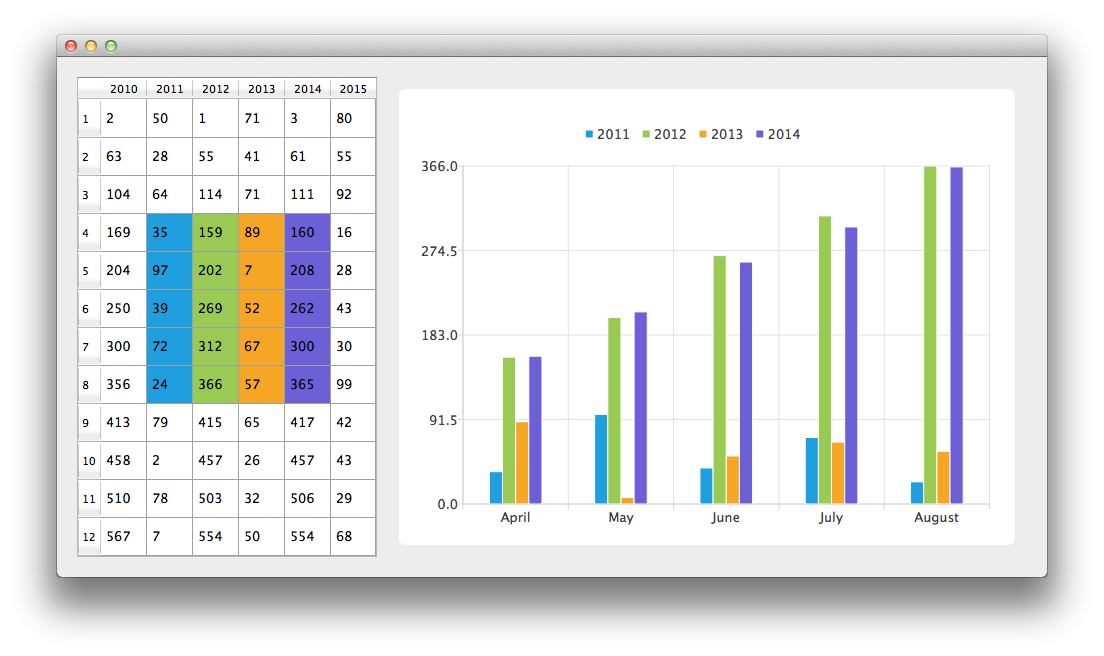
막대형 차트와 함께 데이터 모델 사용
참고: 이 예제는 위젯이 있는 차트 갤러리 예제의 일부입니다.

먼저 CustomTableModel 클래스의 인스턴스를 만들어 보겠습니다. CustomTableModel 클래스는 QAbstractTableModel 에서 파생된 것으로, 이 예제의 목적을 위해 만들어졌습니다. 이 클래스의 생성자는 모델의 내부 데이터 저장소를 차트 예제에 필요한 데이터로 채웁니다.
auto model = new BarModelMapperModel(this);
이제 차트와 QTableView 에 모두 표시할 데이터가 있는 모델이 생겼습니다. 먼저 QTableView 을 생성하고 모델을 데이터 소스로 사용하도록 합니다. 데이터를 보기 좋게 표시하기 위해 테이블 보기의 최소 너비를 설정하고 헤더 크기 조정 모드를 늘리기로 변경합니다.
// create table view and add model to it
auto tableView = new QTableView(this);
tableView->setModel(model);
tableView->setMinimumWidth(300);
tableView->horizontalHeader()->setSectionResizeMode(QHeaderView::Stretch);
tableView->verticalHeader()->setSectionResizeMode(QHeaderView::Stretch);
model->setParent(tableView);
이제 차트에 동일한 데이터를 표시하려면 QChart 인스턴스가 필요합니다. 애니메이션도 활성화했습니다. 모델 데이터의 수정이 차트에 어떤 영향을 미치는지 더 쉽게 확인할 수 있습니다.
아래 코드의 첫 번째 줄은 새 막대 시리즈를 만듭니다. 첫 번째 행과 행 카운트 변수는 사용자 지정 모델 매핑을 정의하는 데 사용됩니다. 사용자 지정 매핑을 사용하면 모델에서 데이터의 일부만 가져올 수 있습니다. 이 경우 인덱스가 3인 행부터 5개 행의 데이터를 가져옵니다. 다음 세 줄은 QVBarModelMapper 클래스의 인스턴스를 만들고 막대 집합의 데이터를 인덱스가 1에서 4(포함)인 모델의 열에서 가져와야 한다고 지정합니다. 시리즈와 모델 간의 연결을 만들기 위해 두 개체를 모두 QVBarModelMapper 로 설정합니다.
마지막으로 시리즈가 차트에 추가됩니다.
auto series = new QBarSeries;

int first = 3;
int count = 5;
auto mapper = new QVBarModelMapper(this);
mapper->setFirstBarSetColumn(1);
mapper->setLastBarSetColumn(4);
mapper->setFirstRow(first);
mapper->setRowCount(count);
mapper->setSeries(series);
mapper->setModel(model);
chart->addSeries(series);
QTableView 에서 어떤 데이터가 어떤 막대 집합에 해당하는지 표시하기 위해 이 예에서는 테이블 색상을 사용합니다. 시리즈가 차트에 추가되면 현재 선택된 테마에 따라 색상이 할당됩니다. 아래 코드는 시리즈에서 해당 색상을 추출하여 색상이 지정된 QTableView 을 만드는 데 사용합니다. 뷰의 색상 지정은 QChart 기능의 일부가 아닙니다.
// for storing color hex from the series
QString seriesColorHex = "#000000";

// get the color of the series and use it for showing the mapped area
QList<QBarSet *> barsets = series->barSets();
for (int i = 0; i < barsets.count(); i++) {
    seriesColorHex = "#" + QString::number(barsets.at(i)->brush().color().rgb(), 16).right(6).toUpper();
    model->addMapping(seriesColorHex, QRect(1 + i, first, 1, barsets.at(i)->count()));
}
차트의 축에 데이터의 의미를 설명하는 카테고리를 배치하고 싶습니다. 다음 코드 조각은 이를 수행하는 방법을 보여줍니다.
QStringList categories {"April",  "May", "June", "July", "August"};
auto axisX = new QBarCategoryAxis;
axisX->append(categories);
chart->addAxis(axisX, Qt::AlignBottom);
series->attachAxis(axisX);
auto axisY = new QValueAxis;
chart->addAxis(axisY, Qt::AlignLeft);
series->attachAxis(axisY);
QGraphicsScene 설정을 피하기 위해 QChartView 클래스를 사용합니다. QChart 객체 포인터는 QChartView 생성자의 매개변수로 사용됩니다. 렌더링을 더 멋지게 보이게 하기 위해 앤티앨리어싱이 켜져 있고 차트뷰 위젯의 최소 크기가 설정되어 있습니다.
auto chartView = new QChartView(chart, this);
chartView->setRenderHint(QPainter::Antialiasing);
마지막으로 두 위젯을 레이아웃에 배치하고 레이아웃을 애플리케이션 레이아웃으로 사용합니다.
// create main layout
auto mainLayout = new QGridLayout;
mainLayout->setHorizontalSpacing(10);
mainLayout->addWidget(tableView, 1, 0);
mainLayout->addWidget(chartView, 1, 1);
mainLayout->setColumnStretch(1, 1);
mainLayout->setColumnStretch(0, 0);
setLayout(mainLayout);
애플리케이션이 준비되었습니다. 테이블 보기에서 데이터를 수정하고 차트에 어떤 영향을 미치는지 확인해 보세요.
© 2025 The Qt Company Ltd. Documentation contributions included herein are the copyrights of their respective owners. The documentation provided herein is licensed under the terms of the GNU Free Documentation License version 1.3 as published by the Free Software Foundation. Qt and respective logos are trademarks of The Qt Company Ltd. in Finland and/or other countries worldwide. All other trademarks are property of their respective owners.

