
차트 위에 설명 상자 그리기
참고: 이 내용은 ‘위젯이 포함된 차트’ 갤러리 예제의 일부입니다.
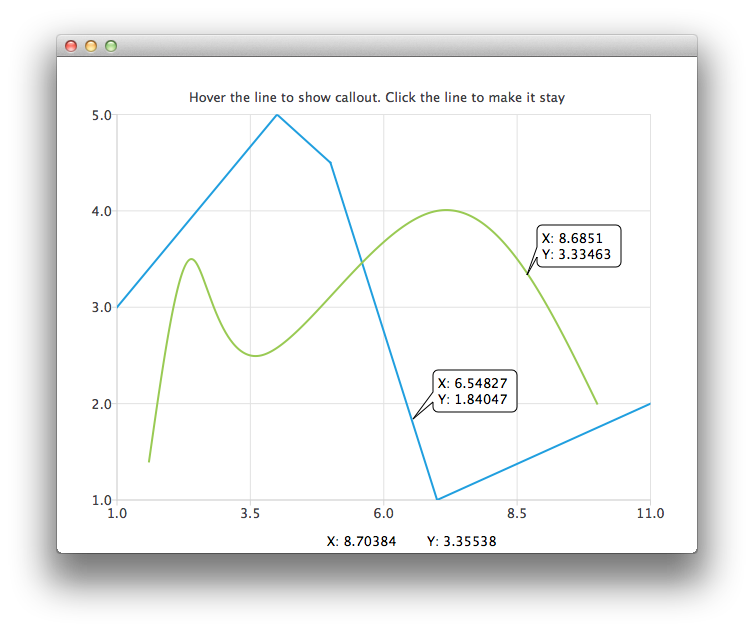
QChart 클래스는 장면 좌표와 시계열 영역(축 범위로 정의됨) 간의 매핑을 수행하는 두 가지 메서드를 제공합니다.
QPointF QChart::mapToPosition(const &value, QAbstractSeries *series) QPointF
QPointF QChart::mapToValue(const &position, QAbstractSeries *series) QPointF
© 2026 The Qt Company Ltd. Documentation contributions included herein are the copyrights of their respective owners. The documentation provided herein is licensed under the terms of the GNU Free Documentation License version 1.3 as published by the Free Software Foundation. Qt and respective logos are trademarks of The Qt Company Ltd. in Finland and/or other countries worldwide. All other trademarks are property of their respective owners.
