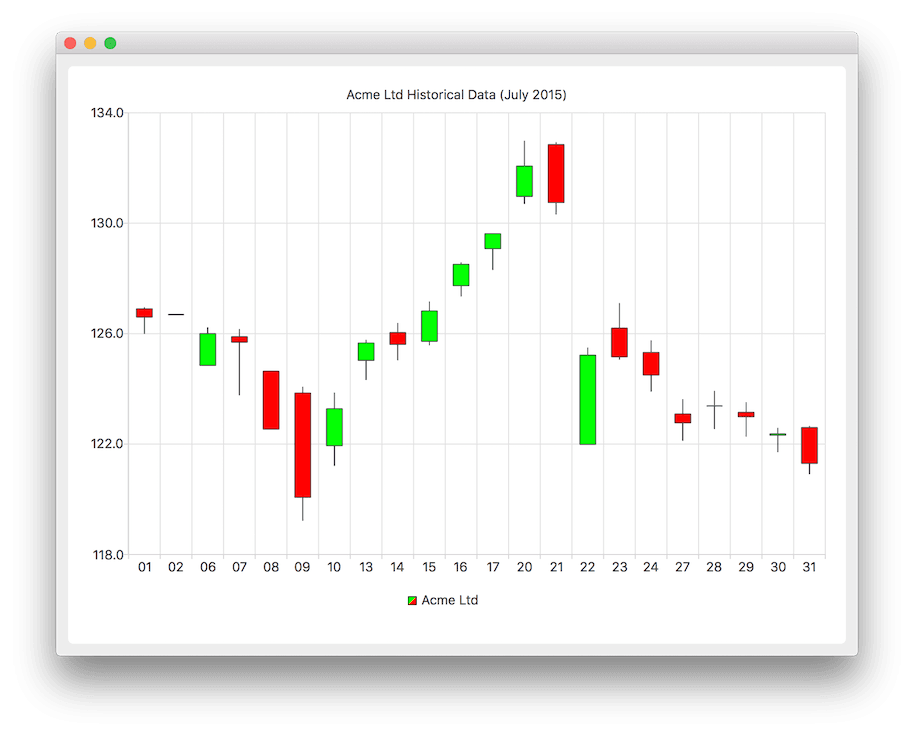
캔들스틱 차트 만들기
참고: 이 예제는 위젯이 있는 차트 갤러리 예제의 일부입니다.

캔들스틱 차트를 표시하려면 먼저 QCandlestickSeries 를 만들어 일별 데이터를 처리합니다. 또한 사용자 지정 증가 및 감소 바디 색상을 지정합니다.
auto acmeSeries = new QCandlestickSeries;
acmeSeries->setName("Acme Ltd");
acmeSeries->setIncreasingColor(QColor(Qt::green));
acmeSeries->setDecreasingColor(QColor(Qt::red));
QFile 는 비연속 데이터가 보관된 텍스트 파일에 액세스하는 데 사용됩니다. CandlestickDataReader 은 텍스트 파일을 읽고 데이터에서 개가, 고가, 저가, 종가 및 타임스탬프 값을 찾기 위한 보조 클래스입니다. CandlestickDataReader 메서드는 나중에 자세히 설명합니다. readCandlestickSet() 메서드는 값을 읽고 호출자에게 반환하는 QCandlestickSet 항목으로 설정합니다. 반환된 QCandlestickSet 항목이 시리즈에 추가됩니다. 나중에 사용할 수 있도록 사용자 정의 카테고리 목록도 저장합니다.
QFile acmeData(":candlestick");
if (!acmeData.open(QIODevice::ReadOnly | QIODevice::Text)) {
    m_loadError = QStringLiteral("Failed to load '%1' file.").arg(acmeData.fileName());
    return false;
}

QStringList categories;

CandlestickDataReader dataReader(&acmeData);
while (!dataReader.atEnd()) {
    QCandlestickSet *set = dataReader.readCandlestickSet();
    if (set) {
        acmeSeries->append(set);
        categories << QDateTime::fromMSecsSinceEpoch(set->timestamp()).toString("dd");
    }
}
아래에서 새 QChart 인스턴스가 생성되고 이전에 생성된 시리즈 객체가 여기에 추가됩니다. 또한 제목을 정의하고 애니메이션을 QChart::SeriesAnimation 으로 설정합니다.
auto chart = new QChart;
chart->addSeries(acmeSeries);
chart->setTitle("Acme Ltd. Historical Data (July 2015)");
chart->setAnimationOptions(QChart::SeriesAnimations);
여기서는 차트에 프레젠테이션의 기본 축을 만들도록 요청합니다. 그런 다음 차트에서 축에 대한 포인터를 쿼리한 다음 이전에 저장한 사용자 지정 카테고리 목록에서 카테고리를 설정하여 가로 축에 대한 사용자 지정 카테고리를 설정합니다. 또한 차트에서 축의 포인터를 쿼리한 다음 해당 축의 최소값과 최대값을 설정하여 세로축의 범위를 설정합니다.
chart->createDefaultAxes();

auto axisX = qobject_cast<QBarCategoryAxis *>(chart->axes(Qt::Horizontal).at(0));
axisX->setCategories(categories);

auto axisY = qobject_cast<QValueAxis *>(chart->axes(Qt::Vertical).at(0));
axisY->setMax(axisY->max() * 1.01);
axisY->setMin(axisY->min() * 0.99);
아래에서는 범례를 표시하도록 설정하고 차트 하단에 배치합니다.
chart->legend()->setVisible(true);
chart->legend()->setAlignment(Qt::AlignBottom);
마지막으로 차트를 뷰에 추가합니다.
createDefaultChartView(chart);
차트를 표시할 준비가 되었습니다.
여기에서는 readCandlestickSet() 메서드를 자세히 설명합니다. 먼저 파일에서 한 줄을 읽고, #으로 시작하는 줄은 주석 줄로 간주하여 거부합니다.
QString line = m_textStream.readLine();
if (line.startsWith("#") || line.isEmpty())
    return nullptr;
파일에서 데이터는 공백으로 구분된 숫자 시퀀스로 정렬됩니다. 이 코드 조각에서 줄은 단일 숫자 문자열로 분할되어 QStringList 에 저장됩니다.
QStringList strList = line.split(QLatin1Char(' '), Qt::SkipEmptyParts);
if (strList.count() != 5)
    return nullptr;
연속형 데이터에서 값을 선택하려면 다음 코드가 사용됩니다. strList 의 값은 타임스탬프, 열기, 높음, 낮음, 닫기 순서로 저장됩니다.
const qreal timestamp = strList.at(0).toDouble();
const qreal open = strList.at(1).toDouble();
const qreal high = strList.at(2).toDouble();
const qreal low = strList.at(3).toDouble();
const qreal close = strList.at(4).toDouble();
마지막으로 다음 스니펫은 QCandlestickSet 을 새로 만들고 필요한 모든 값을 제공하는 방법을 보여줍니다.
auto candlestickSet = new QCandlestickSet(timestamp);
candlestickSet->setOpen(open);
candlestickSet->setHigh(high);
candlestickSet->setLow(low);
candlestickSet->setClose(close);
© 2025 The Qt Company Ltd. Documentation contributions included herein are the copyrights of their respective owners. The documentation provided herein is licensed under the terms of the GNU Free Documentation License version 1.3 as published by the Free Software Foundation. Qt and respective logos are trademarks of The Qt Company Ltd. in Finland and/or other countries worldwide. All other trademarks are property of their respective owners.

