테마로 차트 만들기
참고: 이것은 위젯이 있는 차트 갤러리 예제의 일부입니다.
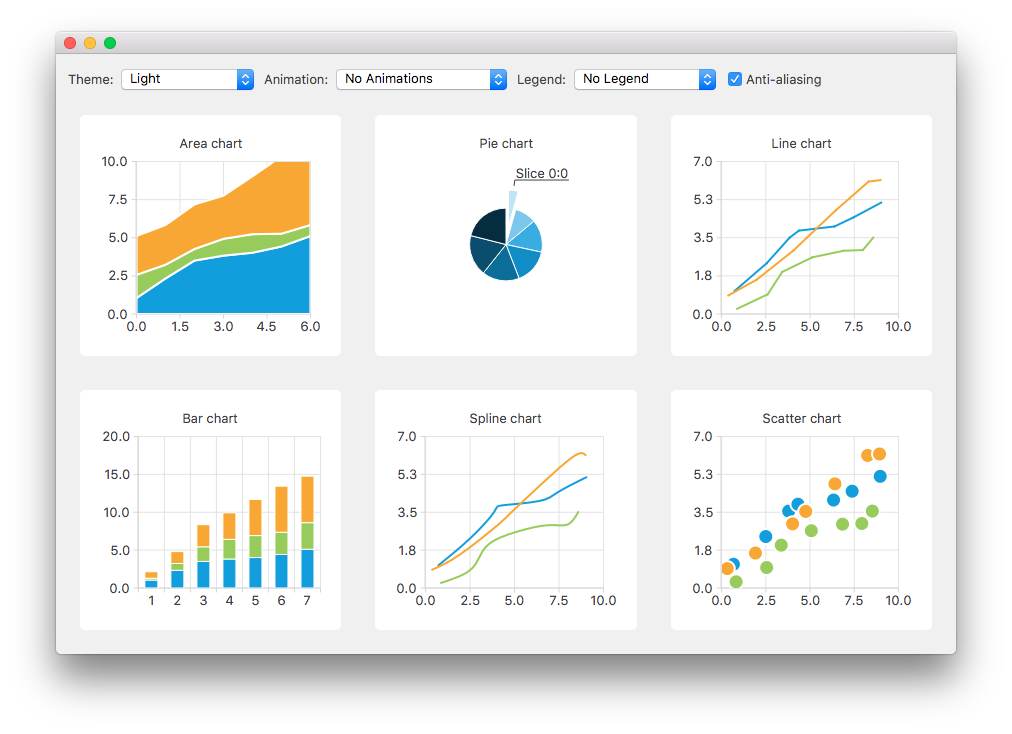
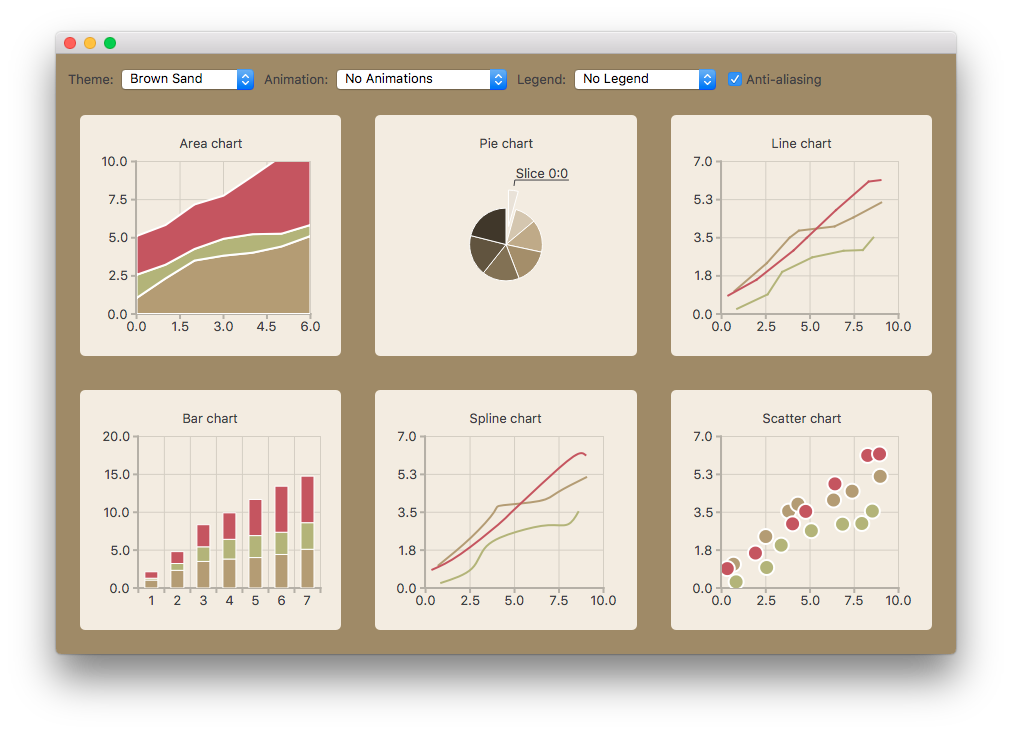
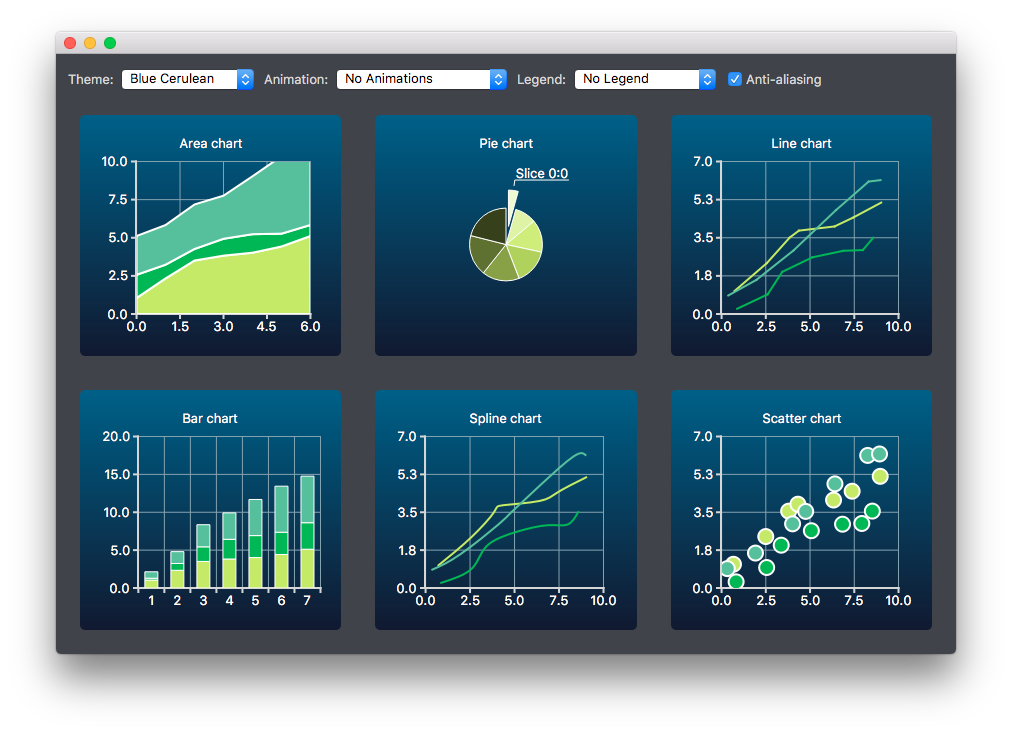
여기에서는 지원되는 일부 차트 유형에 대한 다양한 기본 제공 테마의 모양과 느낌을 변경합니다.


차트 만들기
다양한 유형의 차트가 생성되어 레이아웃에 개별적으로 추가됩니다. 예를 들어 꺾은선형 차트는 다음과 같이 생성됩니다. 다른 차트 유형의 생성은 비슷합니다.
먼저 차트가 생성됩니다.
auto chart = new QChart;
chart->setTitle("Line Chart");
공통의 무작위 데이터 세트가 생성되어 목록에 배치됩니다. 이 목록은 각 차트 유형에서 차트의 시리즈에 데이터를 추가하는 데 사용됩니다. 라인 시리즈의 경우 QLineSeries 인스턴스가 생성되어 차트에 추가됩니다.
QString name("Series ");
int nameIndex = 0;
for (const DataList &list : m_dataTable) {
    auto series = new QLineSeries(chart);
    for (const Data &data : list)
        series->append(data.first);
    series->setName(name + QString::number(nameIndex));
    nameIndex++;
    chart->addSeries(series);
}
라인 계열의 경우 기본 축이 생성됩니다. 또한 시리즈에 사용되는 데이터의 범위에 따라 축의 범위를 지정합니다.
chart->createDefaultAxes();
chart->axes(Qt::Horizontal).first()->setRange(0, m_valueMax);
chart->axes(Qt::Vertical).first()->setRange(0, m_valueCount);
또한 레이블과 Y축 사이에 더 많은 공간을 추가하고 싶습니다. 이를 위해 레이블에 공백 문자를 추가하는 레이블 형식을 지정합니다.
// Add space to label to add space between labels and axis
auto axisY = qobject_cast<QValueAxis *>(chart->axes(Qt::Vertical).first());
Q_ASSERT(axisY);
axisY->setLabelFormat("%.1f  ");
마지막으로 꺾은선형 차트가 그리드 레이아웃에 추가됩니다.
chartView = new QChartView(createLineChart(), this);
m_ui->gridLayout->addWidget(chartView, 1, 2);
테마 변경하기
사용자는 예제에서 사용할 기본 제공 테마를 선택할 수 있습니다. 그러면 이 테마가 레이아웃의 모든 차트에 적용됩니다.
auto theme = static_cast<QChart::ChartTheme>(
            m_ui->themeComboBox->itemData(m_ui->themeComboBox->currentIndex()).toInt());
    ...
chartView->chart()->setTheme(theme);
애니메이션, 범례 및 앤티 앨리어싱 변경하기
이 예제에서는 애니메이션, 범례 및 앤티 앨리어싱을 변경하면 차트의 모양에 어떤 영향을 미치는지 확인할 수 있습니다.
사용자의 선택에 따라 사용된 애니메이션 유형이 각 차트에 설정됩니다. 차트에 애니메이션이 없거나 그리드 축이나 시리즈 또는 둘 다에 애니메이션이 있을 수 있습니다.
QChart::AnimationOptions options(
            m_ui->animatedComboBox->itemData(m_ui->animatedComboBox->currentIndex()).toInt());
if (!m_charts.isEmpty() && m_charts.at(0)->chart()->animationOptions() != options) {
    for (QChartView *chartView : charts)
        chartView->chart()->setAnimationOptions(options);
}
차트는 범례와 함께 표시할 수 있습니다. 범례는 차트의 다른 면에 맞춰 정렬할 수 있습니다.
Qt::Alignment alignment(
            m_ui->legendComboBox->itemData(m_ui->legendComboBox->currentIndex()).toInt());

if (!alignment) {
    for (QChartView *chartView : charts)
        chartView->chart()->legend()->hide();
} else {
    for (QChartView *chartView : charts) {
        chartView->chart()->legend()->setAlignment(alignment);
        chartView->chart()->legend()->show();
    }
}
사용자는 앤티 앨리어싱 옵션을 변경하면 차트의 모양이 어떻게 바뀌는지 확인할 수도 있습니다. 앤티 앨리어싱은 사용자의 선택에 따라 업데이트됩니다.
bool checked = m_ui->antialiasCheckBox->isChecked();
for (QChartView *chart : charts)
    chart->setRenderHint(QPainter::Antialiasing, checked);
© 2025 The Qt Company Ltd. Documentation contributions included herein are the copyrights of their respective owners. The documentation provided herein is licensed under the terms of the GNU Free Documentation License version 1.3 as published by the Free Software Foundation. Qt and respective logos are trademarks of The Qt Company Ltd. in Finland and/or other countries worldwide. All other trademarks are property of their respective owners.

