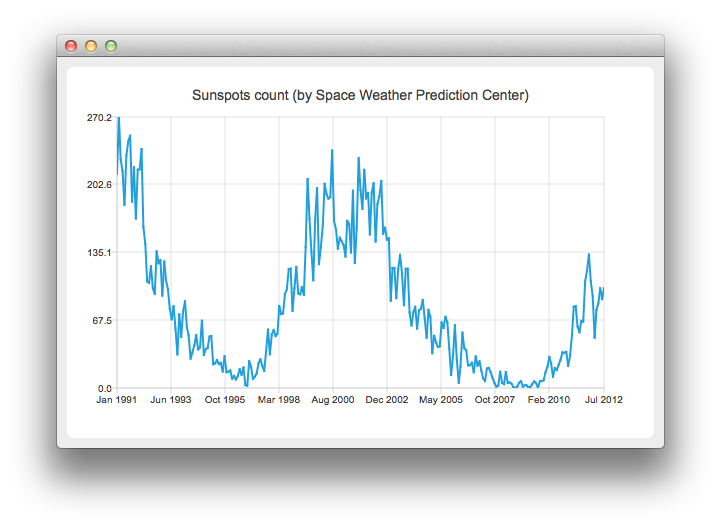
날짜 및 시간 축이 있는 꺾은선형 차트
참고: 이 예제는 위젯이 있는 차트 갤러리 예제의 일부입니다.

예제 실행하기
에서 예제를 실행하려면 Qt Creator에서 Welcome 모드를 열고 Examples 에서 예제를 선택합니다. 자세한 내용은 Qt Creator: 자습서를 참조하세요 : 빌드 및 실행을 참조하세요.
꺾은선형 차트 만들기
꺾은선형 차트를 만들려면 QLineSeries 인스턴스가 필요합니다. 하나 만들어 보겠습니다.
auto series = new QLineSeries;
이 차트에는 태양 흑점의 수가 시간에 따라 어떻게 변하는지를 표시합니다. 데이터(우주 날씨 예측 센터의 데이터)는 텍스트 파일에서 읽습니다.
아래 코드 조각에서 QDateTime::toMSecsSinceEpoch 메서드가 QDateTime 객체를 QLineSeries add 메서드에 전달할 수 있는 숫자로 변환하는 데 어떻게 사용되는지 살펴보세요.
// data from http://www.swpc.noaa.gov/ftpdir/weekly/RecentIndices.txt
// http://www.swpc.noaa.gov/ftpdir/weekly/README
// http://www.weather.gov/disclaimer
QFile sunSpots(":sun_spots");
if (!sunSpots.open(QIODevice::ReadOnly | QIODevice::Text)) {
    m_loadError = QStringLiteral("Failed to load '%1' file.").arg(sunSpots.fileName());
    return false;
}

QTextStream stream(&sunSpots);
while (!stream.atEnd()) {
    QString line = stream.readLine();
    if (line.startsWith("#") || line.startsWith(":"))
        continue;
    QStringList values = line.split(QLatin1Char(' '), Qt::SkipEmptyParts);
    QDateTime momentInTime;
    momentInTime.setDate(QDate(values[0].toInt(), values[1].toInt() , 15));
    series->append(momentInTime.toMSecsSinceEpoch(), values[2].toDouble());
}
sunSpots.close();
차트에 데이터를 표시하려면 QChart 인스턴스가 필요합니다. 여기에 시리즈를 추가하고, 범례를 숨기고, 기본 축을 만들고, 차트 제목을 설정합니다.
auto chart = new QChart;
chart->addSeries(series);
chart->legend()->hide();
chart->setTitle("Sunspots count (by Space Weather Prediction Center)");
QLineSeries 을 사용하므로 createDefaultAxes 를 호출하면 QValueAxis 이 X축과 Y축으로 모두 생성됩니다. QDateTimeAxis 을 사용하려면 차트에 수동으로 설정해야 합니다. 먼저 QDateTimeAxis 인스턴스를 만든 다음 표시할 틱 수를 설정합니다. 태양 흑점의 수는 해당 월의 평균으로 제공됩니다. 따라서 축 레이블에 시간과 요일에 대한 정보를 포함할 필요가 없습니다. 이는 사용자 지정 레이블 형식을 설정하면 됩니다. 사용 가능한 형식 옵션에 대해 알아보려면 QDateTime::toString() 메서드 설명서를 참조하세요.
auto axisX = new QDateTimeAxis;
axisX->setTickCount(10);
axisX->setFormat("MMM yyyy");
axisX->setTitleText("Date");
chart->addAxis(axisX, Qt::AlignBottom);
series->attachAxis(axisX);

auto axisY = new QValueAxis;
axisY->setLabelFormat("%i");
axisY->setTitleText("Sunspots count");
chart->addAxis(axisY, Qt::AlignLeft);
series->attachAxis(axisY);
그런 다음 QChart 을 매개변수로 사용하여 QChartView 객체를 만듭니다. 이렇게 하면 QGraphicsView 장면을 직접 만들 필요가 없습니다. 또한 앤티앨리어싱을 설정하여 렌더링된 선이 더 멋지게 보이도록 합니다.
createDefaultChartView(chart);
차트를 표시할 준비가 되었습니다.
© 2025 The Qt Company Ltd. Documentation contributions included herein are the copyrights of their respective owners. The documentation provided herein is licensed under the terms of the GNU Free Documentation License version 1.3 as published by the Free Software Foundation. Qt and respective logos are trademarks of The Qt Company Ltd. in Finland and/or other countries worldwide. All other trademarks are property of their respective owners.

