도넛 분석 차트 만들기
참고: 이 예제는 위젯이 있는 차트 갤러리 예제의 일부입니다.

도넛 분석 차트 만들기
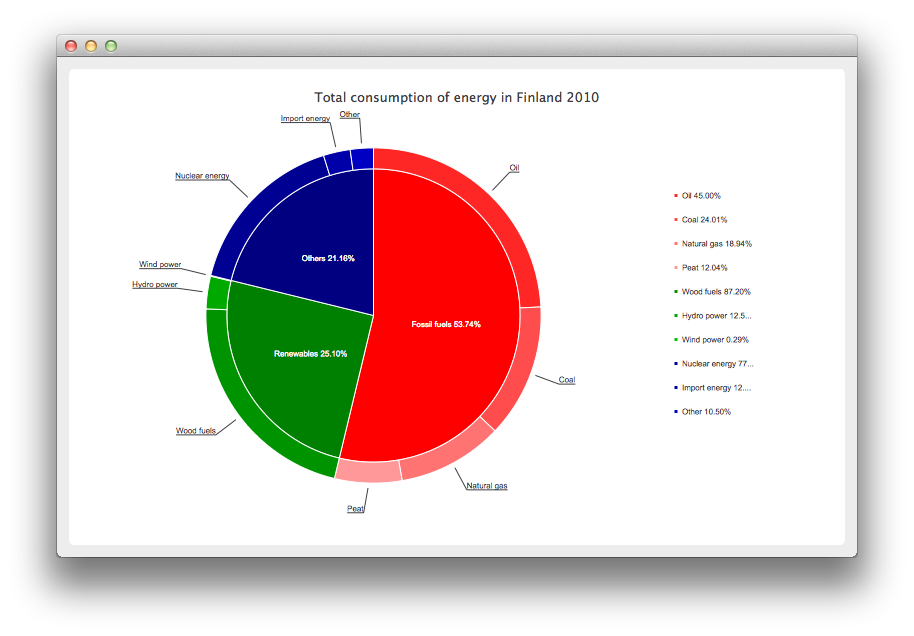
먼저 차트에 대한 몇 가지 데이터를 정의해 보겠습니다.
// Graph is based on data of 'Total consumption of energy increased by 10 per cent in 2010'
// Statistics Finland, 13 December 2011
// http://www.stat.fi/til/ekul/2010/ekul_2010_2011-12-13_tie_001_en.html

auto series1 = new QPieSeries;
series1->setName("Fossil fuels");
series1->append("Oil", 353295);
series1->append("Coal", 188500);
series1->append("Natural gas", 148680);
series1->append("Peat", 94545);

auto series2 = new QPieSeries;
series2->setName("Renewables");
series2->append("Wood fuels", 319663);
series2->append("Hydro power", 45875);
series2->append("Wind power", 1060);

auto series3 = new QPieSeries;
series3->setName("Others");
series3->append("Nuclear energy", 238789);
series3->append("Import energy", 37802);
series3->append("Other", 32441);
그런 다음 데이터를 추가하는 차트를 만듭니다. 이 차트는 QChart 에서 파생된 자체 차트입니다.
auto donutBreakdown = new DonutBreakdownChart;
donutBreakdown->setAnimationOptions(QChart::AllAnimations);
donutBreakdown->setTitle("Total consumption of energy in Finland 2010");
donutBreakdown->legend()->setAlignment(Qt::AlignRight);
donutBreakdown->addBreakdownSeries(series1, Qt::red);
donutBreakdown->addBreakdownSeries(series2, Qt::darkGreen);
donutBreakdown->addBreakdownSeries(series3, Qt::darkBlue);
자체 차트는 생성자에서 주 계열을 만들고, 이 주 계열이 분석 계열에서 제공한 데이터를 집계하는 방식으로 작동합니다. 이것이 중앙에 있는 원형 차트입니다.
DonutBreakdownChart::DonutBreakdownChart(QGraphicsItem *parent, Qt::WindowFlags wFlags)
    : QChart(QChart::ChartTypeCartesian, parent, wFlags)
{
    // create the series for main center pie
    m_mainSeries = new QPieSeries;
    m_mainSeries->setPieSize(0.7);
    QChart::addSeries(m_mainSeries);
}
분석 계열이 추가되면 데이터는 주 계열에 슬라이스를 만드는 데 사용되며, 분석 계열 자체는 주 계열의 해당 슬라이스와 정렬되도록 배치된 도넛 세그먼트를 만드는 데 사용됩니다.
void DonutBreakdownChart::addBreakdownSeries(QPieSeries *breakdownSeries, QColor color)
{
    QFont font("Arial", 8);

    // add breakdown series as a slice to center pie
    auto mainSlice = new DonutBreakdownMainSlice(breakdownSeries);
    mainSlice->setName(breakdownSeries->name());
    mainSlice->setValue(breakdownSeries->sum());
    m_mainSeries->append(mainSlice);

    // customize the slice
    mainSlice->setBrush(color);
    mainSlice->setLabelVisible();
    mainSlice->setLabelColor(Qt::white);
    mainSlice->setLabelPosition(QPieSlice::LabelInsideHorizontal);
    mainSlice->setLabelFont(font);

    // position and customize the breakdown series
    breakdownSeries->setPieSize(0.8);
    breakdownSeries->setHoleSize(0.7);
    breakdownSeries->setLabelsVisible();
    const auto slices = breakdownSeries->slices();
    for (QPieSlice *slice : slices) {
        color = color.lighter(115);
        slice->setBrush(color);
        slice->setLabelFont(font);
    }

    // add the series to the chart
    QChart::addSeries(breakdownSeries);

    // recalculate breakdown donut segments
    recalculateAngles();

    // update customize legend markers
    updateLegendMarkers();
}
도넛 세그먼트의 시작 각도와 끝 각도를 계산하는 방법은 다음과 같습니다.
void DonutBreakdownChart::recalculateAngles()
{
    qreal angle = 0;
    const auto slices = m_mainSeries->slices();
    for (QPieSlice *slice : slices) {
        QPieSeries *breakdownSeries = qobject_cast<DonutBreakdownMainSlice *>(slice)->breakdownSeries();
        breakdownSeries->setPieStartAngle(angle);
        angle += slice->percentage() * 360.0; // full pie is 360.0
        breakdownSeries->setPieEndAngle(angle);
    }
}
범례 마커는 분류 비율을 표시하도록 사용자 지정됩니다. 주 수준 슬라이스의 마커는 숨겨집니다.
void DonutBreakdownChart::updateLegendMarkers()
{
    // go through all markers
    const auto allseries = series();
    for (QAbstractSeries *series : allseries) {
        const auto markers = legend()->markers(series);
        for (QLegendMarker *marker : markers) {
            auto pieMarker = qobject_cast<QPieLegendMarker *>(marker);
            if (series == m_mainSeries) {
                // hide markers from main series
                pieMarker->setVisible(false);
            } else {
                // modify markers from breakdown series
                pieMarker->setLabel(QString("%1 %2%")
                                    .arg(pieMarker->slice()->label())
                                    .arg(pieMarker->slice()->percentage() * 100, 0, 'f', 2));
                pieMarker->setFont(QFont("Arial", 8));
            }
        }
    }
}
대신 주 수준 조각은 레이블에 백분율을 표시합니다.
DonutBreakdownMainSlice::DonutBreakdownMainSlice(QPieSeries *breakdownSeries, QObject *parent)
    : QPieSlice(parent),
      m_breakdownSeries(breakdownSeries)
{
    connect(this, &DonutBreakdownMainSlice::percentageChanged,
            this, &DonutBreakdownMainSlice::updateLabel);
}
    ...
void DonutBreakdownMainSlice::updateLabel()
{
    setLabel(QString("%1 %2%").arg(m_name).arg(percentage() * 100, 0, 'f', 2));
}
이제 차트가 정의되었으므로 마지막으로 QChartView 을 만들어 차트를 표시할 수 있습니다.
createDefaultChartView(donutBreakdown);
© 2025 The Qt Company Ltd. Documentation contributions included herein are the copyrights of their respective owners. The documentation provided herein is licensed under the terms of the GNU Free Documentation License version 1.3 as published by the Free Software Foundation. Qt and respective logos are trademarks of The Qt Company Ltd. in Finland and/or other countries worldwide. All other trademarks are property of their respective owners.

