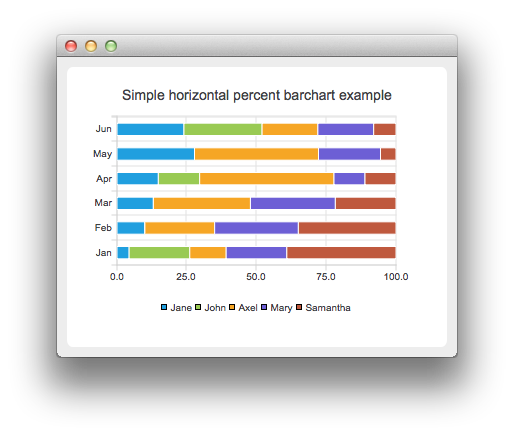
가로 퍼센트 막대 차트 만들기
참고: 이 차트는 위젯이 있는 차트 갤러리 예제의 일부입니다.
가로 퍼센트 막대형 차트는 세트의 데이터를 카테고리별 모든 세트의 백분율로 표시합니다.
가로 막대형 퍼센트 막대 차트를 만드는 것은 일반 막대 차트를 만드는 것과 같지만 가로 막대 차트에서는 QBarSeries 대신 QHorizontalPercentBarSeries API를 사용합니다. 또한 막대 차트에서는 멋진 숫자 알고리즘을 사용하여 Y축 번호 매기기를 더 보기 좋게 만들었습니다. 퍼센트 막대형 차트에서는 최대 Y축 값이 항상 100이기 때문에 그럴 필요가 없습니다.

막대 세트는 모든 막대 차트에서 동일한 방식으로 사용됩니다. 다양한 막대형 차트 간의 차이점을 설명하기 위해 예제에서 동일한 데이터를 사용합니다. 막대형 차트가 시각화하는 데이터는 QBarSet 인스턴스에 의해 정의됩니다. 여기서 집합을 만들고 여기에 데이터를 추가합니다. 여기서 데이터는 << 연산자를 사용하여 추가됩니다. 또는 append 메서드를 사용할 수도 있습니다.
auto set0 = new QBarSet("Jane");
auto set1 = new QBarSet("John");
auto set2 = new QBarSet("Axel");
auto set3 = new QBarSet("Mary");
auto set4 = new QBarSet("Samantha");

*set0 << 1 << 2 << 3 << 4 << 5 << 6;
*set1 << 5 << 0 << 0 << 4 << 0 << 7;
*set2 << 3 << 5 << 8 << 13 << 8 << 5;
*set3 << 5 << 6 << 7 << 3 << 4 << 5;
*set4 << 9 << 7 << 5 << 3 << 1 << 2;
시리즈를 만들고 막대 집합을 추가합니다. 시리즈가 막대 집합의 소유권을 갖습니다. 시리즈는 집합에서 카테고리로 데이터를 그룹화합니다. 각 집합의 첫 번째 값은 첫 번째 범주에, 두 번째 값은 두 번째 범주에 함께 그룹화됩니다.
auto series = new QHorizontalPercentBarSeries;
series->append(set0);
series->append(set1);
series->append(set2);
series->append(set3);
series->append(set4);
여기에서 차트 개체를 만들고 여기에 시리즈를 추가합니다. setTitle을 사용하여 차트의 제목을 설정한 다음 setAnimationOptions(QChart::SeriesAnimations)을 호출하여 시리즈의 애니메이션을 켭니다.
auto chart = new QChart;
chart->addSeries(series);
chart->setTitle("Simple Horizontal Percent Bar Chart");
chart->setAnimationOptions(QChart::SeriesAnimations);
카테고리를 축에 표시하려면 먼저 QBarCategoryAxis 을 만들어야 합니다. 여기에서는 카테고리 목록이 포함된 카테고리 축을 만들어 왼쪽 차트에 추가하여 Y축 역할을 합니다. 차트는 축의 소유권을 갖습니다. X축에는 하단에 정렬된 값 축을 사용합니다.
QStringList categories {"Jan", "Feb", "Mar", "Apr", "May", "Jun"};
auto axisY = new QBarCategoryAxis;
axisY->append(categories);
chart->addAxis(axisY, Qt::AlignLeft);
series->attachAxis(axisY);
auto axisX = new QValueAxis;
chart->addAxis(axisX, Qt::AlignBottom);
series->attachAxis(axisX);
범례도 표시하고 싶습니다. 이를 위해 차트에서 범례 포인터를 가져와서 보이도록 설정합니다. 또한 범례의 정렬을 Qt::AlignBottom 으로 설정하여 범례를 차트 하단에 배치합니다.
chart->legend()->setVisible(true);
chart->legend()->setAlignment(Qt::AlignBottom);
마지막으로 차트를 뷰에 추가합니다.
createDefaultChartView(chart);
© 2025 The Qt Company Ltd. Documentation contributions included herein are the copyrights of their respective owners. The documentation provided herein is licensed under the terms of the GNU Free Documentation License version 1.3 as published by the Free Software Foundation. Qt and respective logos are trademarks of The Qt Company Ltd. in Finland and/or other countries worldwide. All other trademarks are property of their respective owners.

