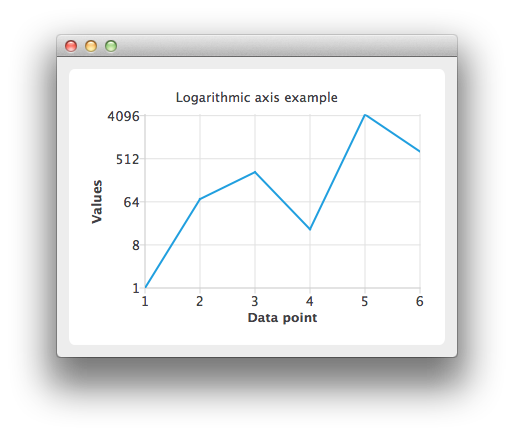
로그 값 축 사용
참고: 이 예제는 위젯이 있는 차트 갤러리 예제의 일부입니다.

QLineSeries 인스턴스를 만들고 여기에 데이터를 추가합니다.
auto series = new QLineSeries;
*series << QPointF(1.0, 1.0) << QPointF(2.0, 73.0) << QPointF(3.0, 268.0) << QPointF(4.0, 17.0)
        << QPointF(5.0, 4325.0) << QPointF(6.0, 723.0);
차트에 데이터를 표시하려면 QChart 인스턴스가 필요합니다. 여기에 시리즈를 추가하고 범례를 숨기고 차트 제목을 설정합니다.
auto chart = new QChart;
chart->addSeries(series);
chart->legend()->hide();
chart->setTitle("Logarithmic Axis");
축을 만듭니다. 축을 차트에 추가하고 시리즈에 첨부합니다.
auto axisX = new QValueAxis;
axisX->setTitleText("Data point");
axisX->setLabelFormat("%i");
axisX->setTickCount(series->count());
chart->addAxis(axisX, Qt::AlignBottom);
series->attachAxis(axisX);

auto axisY = new QLogValueAxis;
axisY->setTitleText("Values");
axisY->setLabelFormat("%g");
axisY->setBase(8.0);
axisY->setMinorTickCount(-1);
chart->addAxis(axisY, Qt::AlignLeft);
series->attachAxis(axisY);
그런 다음 QChart 을 매개변수로 사용하여 QChartView 객체를 만듭니다.
createDefaultChartView(chart);
차트를 표시할 준비가 되었습니다.
© 2025 The Qt Company Ltd. Documentation contributions included herein are the copyrights of their respective owners. The documentation provided herein is licensed under the terms of the GNU Free Documentation License version 1.3 as published by the Free Software Foundation. Qt and respective logos are trademarks of The Qt Company Ltd. in Finland and/or other countries worldwide. All other trademarks are property of their respective owners.

