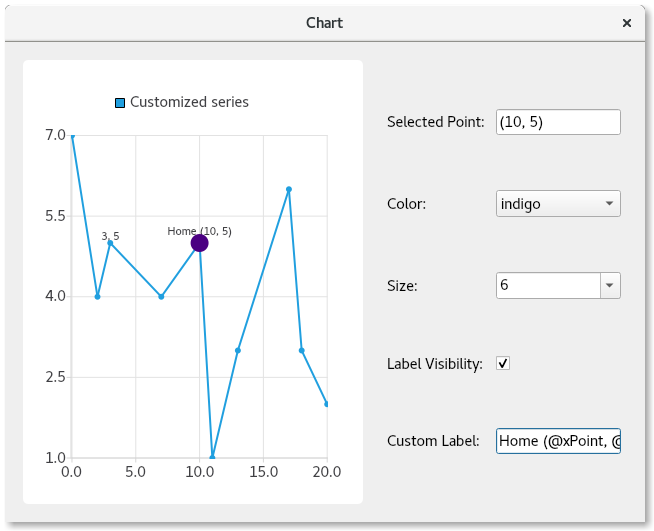
선택된 포인트 구성
참고: 이것은 위젯이 있는 차트 갤러리 예제의 일부입니다.

데모 기능
여기에서 방법을 배웁니다:
- 일련의 포인트에 클릭 선택 기능을 제공합니다.
- 특정 포인트의 개별 구성을 재정의하여 구성합니다:
- 색상
- 크기
- 레이블의 가시성
- 라벨의 텍스트 형식
예제 실행하기
에서 예제를 실행하려면 Qt Creator에서 Welcome 모드를 열고 Examples 에서 예제를 선택합니다. 자세한 내용은 Qt Creator: 튜토리얼을 참조하세요 : 빌드 및 실행을 참조하십시오.
서브클래스 QMainWindow
차트와 컨트롤을 포함하는 QMainWindow 의 서브클래스를 만드는 것으로 시작합니다. 그리고 생성자 구현을 위한 상용구를 제공합니다:
PointConfigurationWidget::PointConfigurationWidget(QWidget *parent)
    : ContentWidget(parent)
{
라인 시리즈 만들기
그런 다음 QLineSeries 를 생성하여 이름을 지정하고, 포인트를 표시하고, 플롯할 포인트를 지정합니다.
m_series = new QLineSeries;
m_series->setPointsVisible(true);
m_series->append({QPointF(0, 7),  QPointF(2, 4),
                  QPointF(3, 5),  QPointF(7, 4),
                  QPointF(10, 5), QPointF(11, 1),
                  QPointF(13, 3), QPointF(17, 6),
                  QPointF(18, 3), QPointF(20, 2)});
포인트 구성 컨트롤 만들기
이제 색상, 크기, 레이블 표시 여부 및 레이블 자체를 구성하는 몇 가지 컨트롤을 만듭니다. 사용자가 컨트롤의 기능을 알 수 있도록 각 컨트롤에 연결된 레이블을 만듭니다.
색상 및 크기에는 QComboBox 를 사용하여 다양한 색상 및 크기 선택 사항으로 채웁니다.
다음으로 마지막 두 개의 컨트롤을 만듭니다. 체크박스는 선택한 포인트의 표시 여부를 제어합니다. 다른 컨트롤은 사용자가 포인트에 대한 사용자 지정 레이블을 제공할 수 있는 QLineEdit 입니다.
포인트는 항상 현재 설정이 표시된 상태로 선택되므로 컨트롤의 초기값은 설정하지 않습니다.
auto selectedPointIndexLabel = new QLabel(tr("Selected Point: "), this);
m_selectedPointIndexLineEdit = new QLineEdit(this);
m_selectedPointIndexLineEdit->setReadOnly(true);

auto colorLabel = new QLabel(tr("Color: "), this);
m_colorCombobox = new QComboBox(this);
QStringList colorStrings = {"red", "orange", "yellow", "green", "blue",
                            "indigo", "violet", "black"};
QStringList trColorStrings = {tr("red"), tr("orange"), tr("yellow"),
                              tr("green"), tr("blue"), tr("indigo"),
                              tr("violet"), tr("black")};
for (int i = 0; i < colorStrings.size(); i++)
    m_colorCombobox->addItem(QIcon(), trColorStrings[i], QColor(colorStrings[i]));

auto sizeLabel = new QLabel(tr("Size: "), this);
m_sizeCombobox = new QComboBox(this);
for (auto size : { 2, 3, 4, 6, 8, 10, 12, 15 })
    m_sizeCombobox->addItem(QIcon(), QString::number(size), size);

auto labelVisibilityLabel = new QLabel(tr("Label Visibility: "), this);
m_labelVisibilityCheckbox = new QCheckBox(this);

auto customLabelLabel = new QLabel(tr("Custom Label: "), this);
m_customLabelLineEdit = new QLineEdit(this);
포인트 선택 시 컨트롤 채우기
이제 컨트롤이 생겼으므로 선택한 점에 대한 현재 컨트롤 값을 설정하는 로직을 제공해야 합니다. 선택한 포인트에 대한 사용자 지정이 없는 경우 전체 계열 값이 사용됩니다. 이 경우 계열이 파란색 점을 표시하도록 설정된 경우 색상 콤보 상자에 파란색 값이 표시됩니다.
선형 계열을 클릭하면 클릭한 점을 조회하고 이전 점 선택을 제거한 다음 클릭한 점을 선택합니다. 이렇게 하면 차트에서 선택한 점이 시각적으로 표시되며, 선택된 점을 나타내기 위해 점이 더 커집니다. 현재 선택된 포인트의 인덱스와 해당 PointConfigurations 는 나중에 사용할 수 있도록 멤버 변수에 저장됩니다.
PointConfigurations 을 쿼리하고 콤보 상자에서 일치하는 값을 조회합니다. 그런 다음 콤보박스의 현재 인덱스가 그에 따라 설정됩니다. 체크박스 및 줄 편집의 경우에도 마찬가지로 PointConfigurations 에서 값을 조회하고 컨트롤이 일치하도록 설정합니다.
QObject::connect(m_series, &QXYSeries::clicked, m_series, [&](const QPointF &point) {
    int index = m_series->points().indexOf(point.toPoint());
    if (index != -1) {
        m_series->deselectAllPoints();
        m_series->selectPoint(index);
        m_selectedPointIndex = index;
        m_selectedPointConfig = m_series->pointConfiguration(index);
        const QPointF selectedPoint(m_series->at(index));
        m_selectedPointIndexLineEdit->setText("(" + QString::number(selectedPoint.x()) + ", " +
                                              QString::number(selectedPoint.y()) + ")");
        PointConfigurations config = m_series->pointConfiguration(index);

        QVariant colorVar = config[QXYSeries::PointConfiguration::Color];
        QColor color = colorVar.isValid() ? colorVar.value<QColor>() : m_series->color();
        if (m_colorCombobox->findData(color) < 0)
            m_colorCombobox->addItem(color.name(), color);
        m_colorCombobox->setCurrentIndex(m_colorCombobox->findData(color));

        QVariant sizeVar = config[QXYSeries::PointConfiguration::Size];
        qreal size = sizeVar.isValid() ? sizeVar.toReal() : m_series->markerSize();
        if (m_sizeCombobox->findData(size) < 0)
            m_sizeCombobox->addItem(QString::number(size), size);
        m_sizeCombobox->setCurrentIndex(m_sizeCombobox->findData(size));

        QVariant labelVisibilityVar = config[QXYSeries::PointConfiguration::LabelVisibility];
        bool labelVisibility = labelVisibilityVar.isValid() ? labelVisibilityVar.toBool() :
                                                              m_series->pointLabelsVisible();
        m_labelVisibilityCheckbox->setChecked(labelVisibility);

        QVariant customLabelVar = config[QXYSeries::PointConfiguration::LabelFormat];
        QString customLabel = customLabelVar.isValid() ? customLabelVar.toString() : "";
        m_customLabelLineEdit->setText(customLabel);
    }
});
선택된 지점을 구성하는 로직 제공
이제 컨트롤이 현재 구성으로 채워졌으므로 컨트롤이 무언가를 수행하도록 만들어야 합니다. 선택한 설정으로 선택된 지점을 구성하는 작업을 수행할 로직에 신호를 연결합니다. 컨트롤과 연결된 QXYSeries::PointConfiguration 값을 m_selectedPointConfig PointConfigurations 멤버 변수에 설정하고 QXYSeries::setPointConfiguration 을 호출하기만 하면 됩니다.
QObject::connect(m_colorCombobox, &QComboBox::activated, m_series, [&](const int) {
    m_selectedPointConfig[QXYSeries::PointConfiguration::Color] = m_colorCombobox->currentData();
    m_series->setPointConfiguration(m_selectedPointIndex, m_selectedPointConfig);
});
QObject::connect(m_sizeCombobox, &QComboBox::activated, m_series, [&](const int) {
    m_selectedPointConfig[QXYSeries::PointConfiguration::Size] = m_sizeCombobox->currentData();
    m_series->setPointConfiguration(m_selectedPointIndex, m_selectedPointConfig);
});
QObject::connect(m_labelVisibilityCheckbox, &QAbstractButton::clicked, m_series, [&](const bool checked) {
    m_selectedPointConfig[QXYSeries::PointConfiguration::LabelVisibility] = checked;
    m_series->setPointConfiguration(m_selectedPointIndex, m_selectedPointConfig);
});
QObject::connect(m_customLabelLineEdit, &QLineEdit::editingFinished, m_series, [&]() {
    m_selectedPointConfig[QXYSeries::PointConfiguration::LabelFormat] = m_customLabelLineEdit->text();
    m_series->setPointConfiguration(m_selectedPointIndex, m_selectedPointConfig);
});
차트 생성 및 컨트롤 배치하기
마지막으로 차트와 그 보기를 만들고, 차트에 시리즈를 추가하고, 창 레이아웃을 만듭니다. 그 일환으로 차트가 처음 그려질 때 geometryChanged 신호에 연결하여 신호를 포착합니다. 이는 처음에 선택한 지점에 대한 정확한 값을 얻기 위한 것입니다. 이 작업을 더 일찍 수행하면 포인트 값이 올바르지 않습니다. 이 연결은 처음 실행된 후 연결이 끊어집니다.
auto chart = new QChart;
chart->addSeries(m_series);
chart->createDefaultAxes();
chart->setTitle("Select points with mouse click");
chart->layout()->setContentsMargins(0, 0, 0, 0);
chart->legend()->setVisible(false);

m_selectInitialPointConnection = QObject::connect(chart, &QChart::geometryChanged, chart, [&]() {
    m_series->selectPoint(4);
    m_series->clicked(m_series->at(m_series->selectedPoints()[0]));
    disconnect(m_selectInitialPointConnection);
});

auto chartView = new QChartView(chart, this);
chartView->setRenderHint(QPainter::Antialiasing);

auto controlWidget = new QWidget(this);
auto controlLayout = new QGridLayout(controlWidget);
controlLayout->setColumnStretch(1, 1);

controlLayout->addWidget(selectedPointIndexLabel, 0, 0);
controlLayout->addWidget(m_selectedPointIndexLineEdit, 0, 1);

controlLayout->addWidget(colorLabel, 1, 0);
controlLayout->addWidget(m_colorCombobox, 1, 1);

controlLayout->addWidget(sizeLabel, 2, 0);
controlLayout->addWidget(m_sizeCombobox, 2, 1);

controlLayout->addWidget(labelVisibilityLabel, 3, 0);
controlLayout->addWidget(m_labelVisibilityCheckbox, 3, 1, 1, 2);

controlLayout->addWidget(customLabelLabel, 4, 0);
controlLayout->addWidget(m_customLabelLineEdit, 4, 1);

auto mainLayout = new QHBoxLayout(this);
mainLayout->addWidget(chartView);
mainLayout->setStretch(0, 1);
mainLayout->addWidget(controlWidget);
이제 개별 차트 포인트를 사용자 지정하는 방법을 보여주는 완전한 기능을 갖춘 애플리케이션이 완성되었습니다.
© 2025 The Qt Company Ltd. Documentation contributions included herein are the copyrights of their respective owners. The documentation provided herein is licensed under the terms of the GNU Free Documentation License version 1.3 as published by the Free Software Foundation. Qt and respective logos are trademarks of The Qt Company Ltd. in Finland and/or other countries worldwide. All other trademarks are property of their respective owners.

