막대의 색상 및 상태 변경하기
참고: 이 예제는 위젯이 있는 차트 갤러리 예제의 일부입니다.
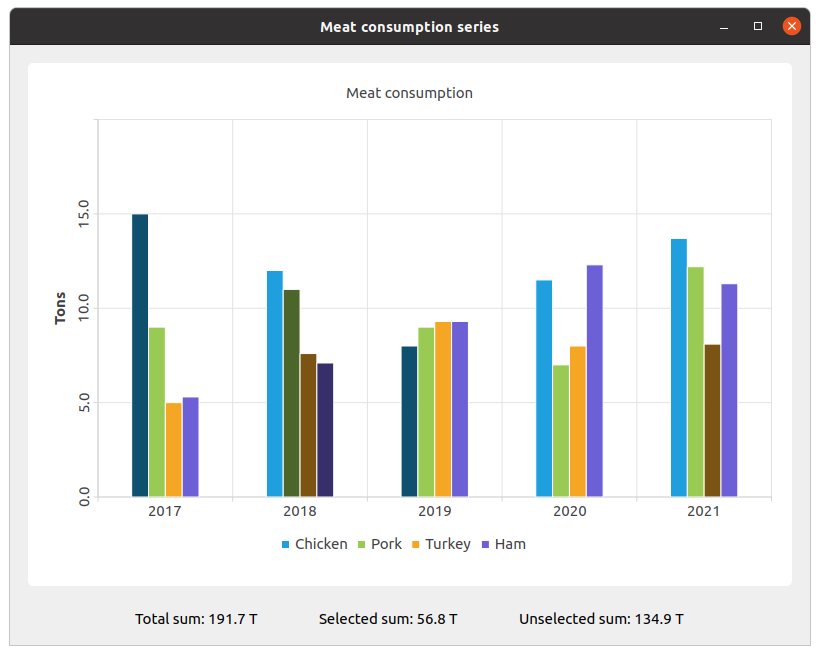
이 예는 setBarSelected()를 사용하여 막대의 색상과 상태를 변경하는 방법을 보여줍니다.

먼저 집합을 만들고 데이터로 채웁니다. 그런 다음 시리즈를 만들고 여기에 데이터를 추가합니다.
QBarSet *setChicken = createChickenSet();
QBarSet *setPork = createPorkSet();
QBarSet *setTurkey = createTurkeySet();
QBarSet *setHam = createHamSet();
qreal totalSum = setChicken->sum() + setPork->sum() + setTurkey->sum() + setHam->sum();
QList<QBarSet *> setList = QList<QBarSet *>{setChicken, setPork, setTurkey, setHam};

auto series = new QBarSeries;
series->append(setList);
차트를 만들고 시리즈를 추가합니다. 또한 차트에 제목을 추가하고, 차트에 애니메이션을 설정하고, 범례를 정렬합니다.
auto chart = new QChart;
chart->addSeries(series);
chart->setTitle(tr("Meat Consumption (Click on bars to select them)"));
chart->setAnimationOptions(QChart::SeriesAnimations);
chart->legend()->setVisible(true);
chart->legend()->setAlignment(Qt::AlignBottom);
chart->layout()->setContentsMargins(0, 0, 0, 0);
여기서 선택한 막대의 색상을 설정합니다.
const auto barSets = series->barSets();
for (QBarSet *barSet : barSets)
    barSet->setSelectedColor(barSet->brush().color().darker());
다음 단계는 축을 추가하는 것입니다. 측정 연도의 경우 QBarCategoryAxis, 값 범위의 경우 QValueAxis.
QStringList categories = createYearCategories();
auto axisX = new QBarCategoryAxis;
axisX->setCategories(categories);
chart->addAxis(axisX, Qt::AlignBottom);
series->attachAxis(axisX);

auto axisY = new QValueAxis;
axisY->setRange(0, 20);
axisY->setTitleText(tr("Tons"));
axisY->setLabelsAngle(-90);
axisY->setTitleVisible(true);
chart->addAxis(axisY, Qt::AlignLeft);
series->attachAxis(axisY);
그런 다음 차트를 넣을 차트 보기를 추가합니다.
auto chartView = new QChartView(chart, this);
chartView->setRenderHint(QPainter::Antialiasing);
여기에서 선택된 막대와 선택되지 않은 막대의 값 레이블을 위한 위젯을 만듭니다.
auto labelWidget = new QWidget(this);
auto labelLayout = new QHBoxLayout(labelWidget);
labelLayout->setAlignment(Qt::AlignCenter);

auto totalSumLabel = new QLabel(tr("Total sum: %1 T").arg(totalSum), this);
labelLayout->addWidget(totalSumLabel);
totalSumLabel->setContentsMargins(0, 0, 54, 0);

auto selectedSumLabel = new QLabel(tr("Selected sum: 0 T"), this);
labelLayout->addWidget(selectedSumLabel);

auto unselectedSumLabel = new QLabel(tr("Unselected sum: %1 T").arg(totalSum), this);
labelLayout->addWidget(unselectedSumLabel);
unselectedSumLabel->setContentsMargins(54, 0, 0, 0);
특정 막대의 선택을 람다를 사용하여 값의 레이블과 연결합니다. set->toggleSelection({index}) 는 선택된 막대를 설정합니다.
QObject::connect(series, &QAbstractBarSeries::clicked, series, [=](int index, QBarSet *set) {
    set->toggleSelection({index});
    qreal selectedSum = 0.;
    for (int i = 0; i < setList.size(); ++i) {
        auto selectedIndices = setList.at(i)->selectedBars();
        for (int k = 0; k < selectedIndices.size(); ++k)
            selectedSum += setList.at(i)->at(selectedIndices.at(k));
    }
    selectedSumLabel->setText(tr("Selected sum: %1 T").arg(selectedSum));
    // Because of rounding errors, selectedSum can result in being bigger than total sum
    qreal unselectedSum = totalSum - selectedSum < 0 ? 0. : totalSum - selectedSum;
    unselectedSumLabel->setText(
        tr("Unselected sum: %1 T")
            .arg(unselectedSum)
        );
});
마지막으로 메인 레이아웃을 만듭니다.
auto mainLayout = new QVBoxLayout(this);

mainLayout->addWidget(chartView);
mainLayout->addWidget(labelWidget);
© 2025 The Qt Company Ltd. Documentation contributions included herein are the copyrights of their respective owners. The documentation provided herein is licensed under the terms of the GNU Free Documentation License version 1.3 as published by the Free Software Foundation. Qt and respective logos are trademarks of The Qt Company Ltd. in Finland and/or other countries worldwide. All other trademarks are property of their respective owners.

