
서피스 그래프 갤러리
Surface3D 그래프를 활용하는 세 가지 방법을 보여주는 갤러리입니다.
표면 그래프 갤러리는 Surface3D 그래프를 활용한 세 가지 맞춤형 기능을 보여줍니다. 각 기능은 애플리케이션 내에서 별도의 탭으로 제공됩니다.
다음 섹션에서는 해당 기능들만 중점적으로 다루며 기본 기능에 대한 설명은 생략합니다. 더 자세한 QML 예제 문서는 ‘간단한 산점도’를 참조하십시오.
예제 실행
다음 경로에서 예제를 실행할 수 있습니다:
- Qt Creator
Welcome 모드를 열고 Examples 에서 예제를 선택하십시오. 자세한 내용은 Qt Creator: 튜토리얼: 빌드 및 실행을 참조하십시오.
- Qt Extension for Visual Studio Code
Command Palette 에서 Qt: Open Qt examples 명령을 실행하고 목록에서 예제를 선택하십시오. 자세한 내용은 Qt Extension for Visual Studio Code: 튜토리얼: 빌드 및 실행을 참조하십시오.
고도 맵
Height Map 탭에서 높이 데이터를 사용하여 표면 그래프를 생성합니다. 사용된 데이터는 뉴질랜드의 루아페후 산과 나우루호에 산의 높이 맵입니다.
그래프에 데이터 추가
데이터는 높이 맵 이미지에서 높이 정보를 읽어오는 `HeightMapSurfaceDataProxy`를 사용하여 설정됩니다. 이 프록시 자체는 `Surface3DSeries`에 포함되어 있습니다. HeightMapSurfaceDataProxy 내부에서 heightMapFile 속성은 높이 데이터가 포함된 이미지 파일을 지정합니다. 프록시의 값 속성은 표면 영역의 너비, 깊이 및 높이에 대한 최소값과 최대값을 정의합니다. z 및 x 값은 실제 위치에 근사한 위도와 경도로 표시되며, y 는 미터 단위로 표시됩니다.
참고: 그래프의종횡비는 실제 크기에 맞춰 설정되지 않았으며, 대신 높이가 과장되어 표시됩니다.
Surface3DSeries {
    id: heightSeries
    flatShadingEnabled: false
    drawMode: Surface3DSeries.DrawSurface

    HeightMapSurfaceDataProxy {
        heightMapFile: "://qml/qmlsurfacegallery/heightmap.png"
        // We don't want the default data values set by heightmap proxy, but use
        // actual coordinate and height values instead
        autoScaleY: true
        minYValue: 740
        maxYValue: 2787
        minZValue: -374 // ~ -39.374411"N
        maxZValue: -116 // ~ -39.115971"N
        minXValue: 472  // ~ 175.471767"E
        maxXValue: 781  // ~ 175.780758"E
    }

    onDrawModeChanged: heightMapView.checkState()
}
데이터 표시
main.qml 에서 데이터를 표시하도록 Surface3D 요소를 설정합니다.
먼저, 표면에 사용할 사용자 정의 그라데이션을 정의합니다. ColorGradient를 사용하여 0.0에서 1.0까지의 위치에 색상을 설정하고, 그래프를 더욱 생생하게 만들기 위해 두 개의 추가 스톱을 추가합니다:
ColorGradient {
    id: surfaceGradient
    ColorGradientStop { position: 0.0; color: "darkgreen"}
    ColorGradientStop { position: 0.15; color: "darkslategray" }
    ColorGradientStop { position: 0.7; color: "peru" }
    ColorGradientStop { position: 1.0; color: "white" }
}
이 요소를 Surface3D에서 사용되는 ` theme `의 ` baseGradients ` 속성에 설정합니다:
theme: Theme3D {
    type: Theme3D.ThemeStoneMoss
    font.family: "STCaiyun"
    font.pointSize: 35
    colorStyle: Theme3D.ColorStyleRangeGradient
    baseGradients: [surfaceGradient] // Use the custom gradient
}
버튼을 사용하여 다른 Surface3D 기능을 제어할 수 있습니다.
첫 번째 버튼은 표면 격자를 표시하거나 숨깁니다. 그리기 모드는 완전히 지울 수 없으므로, 표면 자체가 표시되어 있지 않으면 표면 격자를 숨길 수 없습니다:
onClicked: {
    if (heightSeries.drawMode & Surface3DSeries.DrawWireframe)
        heightSeries.drawMode &= ~Surface3DSeries.DrawWireframe;
    else
        heightSeries.drawMode |= Surface3DSeries.DrawWireframe;
}
두 번째 버튼은 표면 격자 색상을 설정합니다:
onClicked: {
    if (Qt.colorEqual(heightSeries.wireframeColor, "#000000")) {
        heightSeries.wireframeColor = "red";
        text = "Black surface\ngrid color";
    } else {
        heightSeries.wireframeColor = "black";
        text = "Red surface\ngrid color";
    }
}
세 번째 버튼은 표면 그리기 모드에서 표면을 표시하거나 숨깁니다. 그리기 모드를 완전히 초기화할 수 없으므로, 표면 격자가 표시되어 있지 않은 경우 표면 자체를 숨길 수 없습니다:
onClicked: {
    if (heightSeries.drawMode & Surface3DSeries.DrawSurface)
        heightSeries.drawMode &= ~Surface3DSeries.DrawSurface;
    else
        heightSeries.drawMode |= Surface3DSeries.DrawSurface;
}
네 번째 버튼은 셰이딩 모드를 설정합니다. OpenGL ES 시스템에서 예제를 실행하는 경우, 플랫 셰이딩을 사용할 수 없습니다:
onClicked: {
    if (heightSeries.flatShadingEnabled) {
        heightSeries.flatShadingEnabled = false;
        text = "Show\nFlat"
    } else {
        heightSeries.flatShadingEnabled = true;
        text = "Show\nSmooth"
    }
}
나머지 버튼들은 그래프 배경 기능을 제어합니다.
스펙트로그램
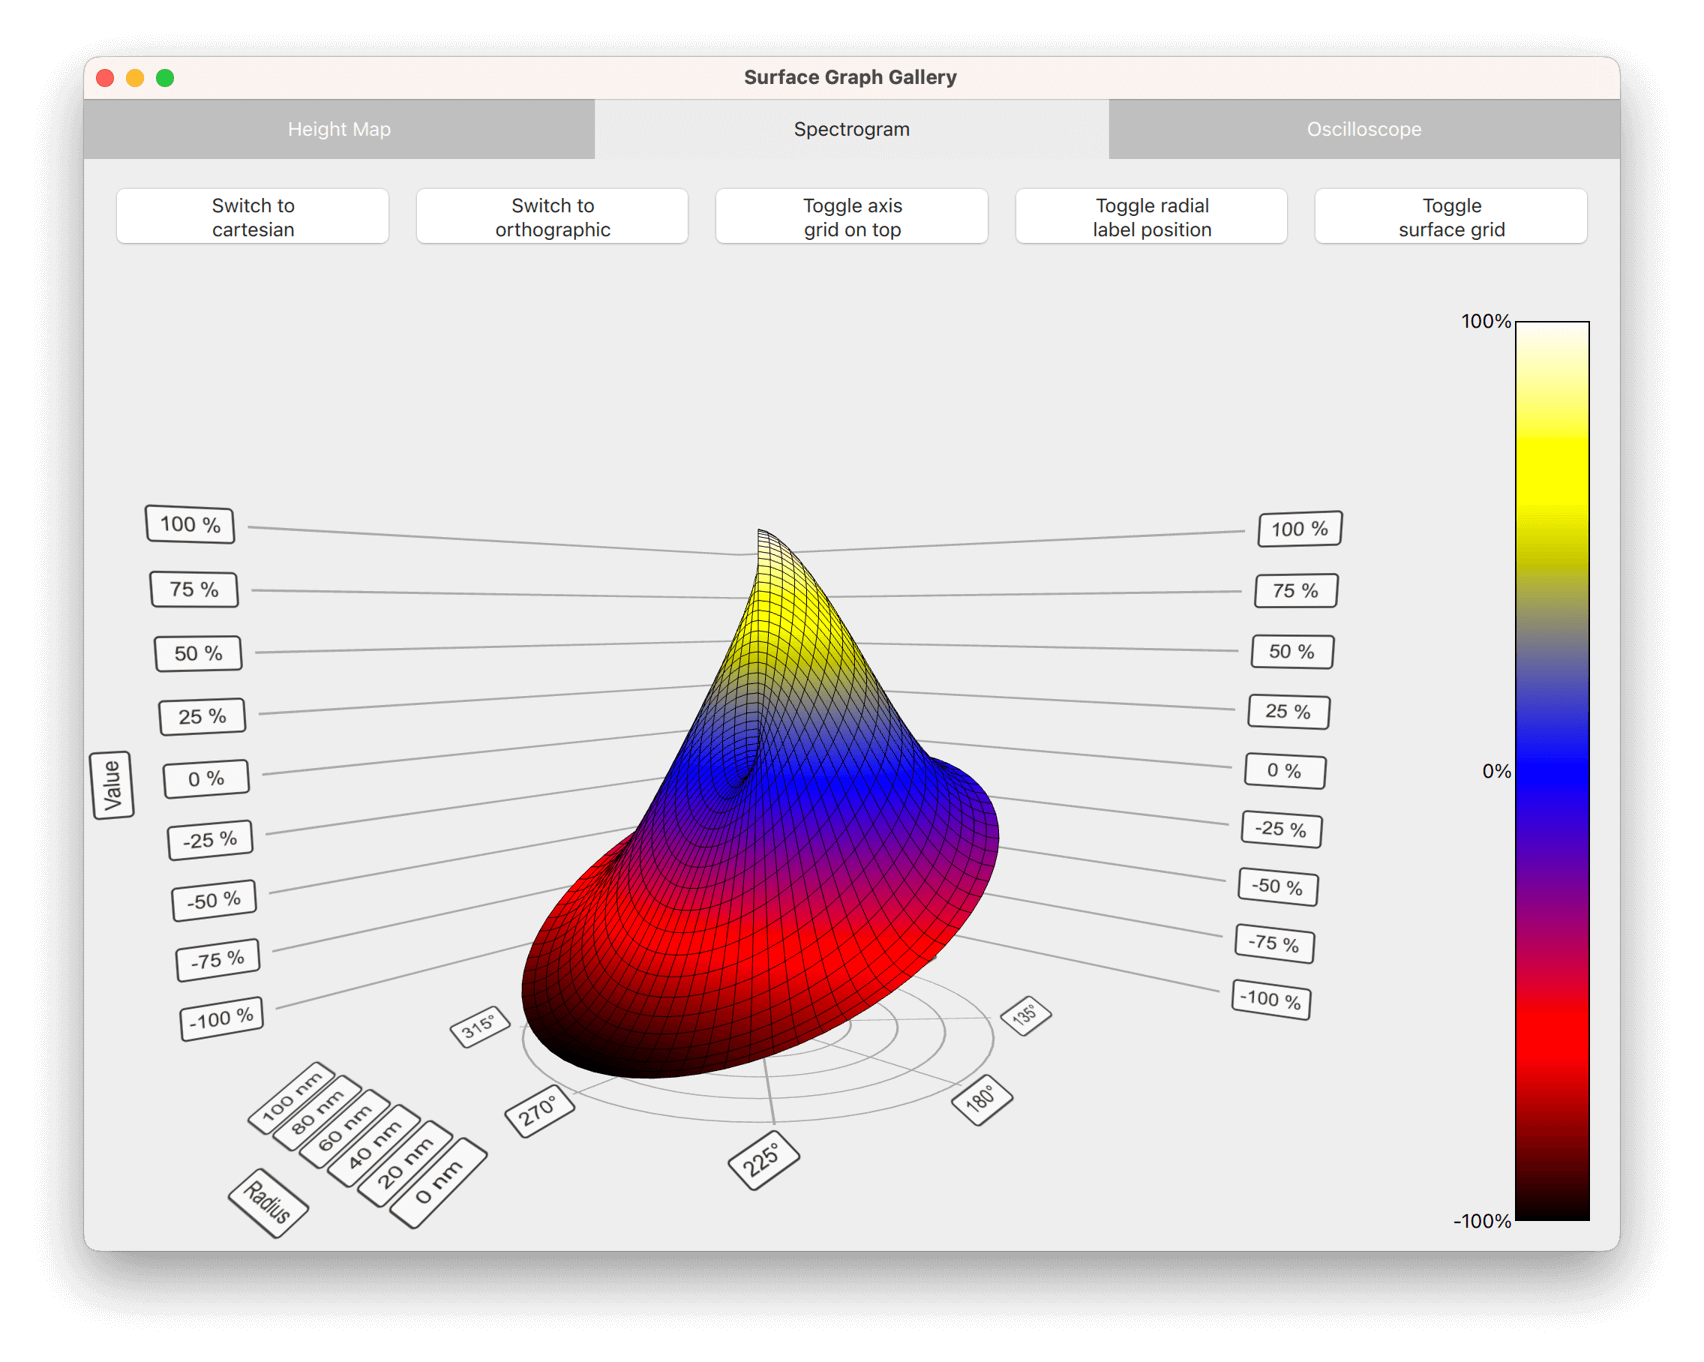
Spectrogram 탭에서는 극좌표 및 직교 좌표 스펙트로그램을 표시하고, 정투영을 사용하여 2D로 보여줍니다.
스펙트로그램은 서로 다른 값을 강조하기 위해 범위 그라디언트가 적용된 표면 그래프입니다. 일반적으로 스펙트로그램은 2차원 표면으로 표시되며, 이는 그래프의 위에서 내려다보는 정사영 뷰로 시뮬레이션됩니다. 2차원 효과를 강화하려면 정사영 모드에서 마우스나 터치를 통한 그래프 회전을 비활성화하십시오.
스펙트로그램 생성
2차원 스펙트로그램을 생성하려면, ItemModelSurfaceDataProxy를 사용하여 Surface3DSeries에 지정된 데이터로 Surface3D 항목을 정의합니다:
Surface3D {
    id: surfaceGraph
    anchors.fill: parent

    Surface3DSeries {
        id: surfaceSeries
        flatShadingEnabled: false
        drawMode: Surface3DSeries.DrawSurface
        baseGradient: surfaceGradient
        colorStyle: Theme3D.ColorStyleRangeGradient
        itemLabelFormat: "(@xLabel, @zLabel): @yLabel"

        ItemModelSurfaceDataProxy {
            itemModel: surfaceData.model
            rowRole: "radius"
            columnRole: "angle"
            yPosRole: "value"
        }
    }
2차원 효과를 활성화하는 주요 속성은 ` orthoProjection `와 ` scene.activeCamera.cameraPreset`입니다. 그래프에 정사투영을 활성화하여 원근감을 제거하고, 그래프를 바로 위에서 내려다보는 방식으로 Y축을 제거합니다:
// Remove the perspective and view the graph from top down to achieve 2D effect
orthoProjection: true
scene.activeCamera.cameraPreset: Camera3D.CameraPresetDirectlyAbove
이 시점에서는 수평 축 격자가 표면에 대부분 가려지므로, 수평 격자가 그래프 위에 그려지도록 뒤집으십시오:
flipHorizontalGrid: true극좌표 스펙트로그램
데이터에 따라 직교 좌표계 그래프 대신 극좌표 그래프를 사용하는 것이 더 자연스러운 경우가 있습니다. 이는 polar 속성을 통해 지원됩니다.
극좌표 모드와 직교 좌표 모드 간을 전환할 수 있는 버튼을 추가합니다:
Button {
    id: polarToggle
    anchors.margins: 5
    anchors.left: parent.left
    anchors.top: parent.top
    width: spectrogramView.buttonWidth // Calculated elsewhere based on screen orientation
    text: "Switch to\n" + (surfaceGraph.polar ? "cartesian" : "polar")
    onClicked: surfaceGraph.polar = !surfaceGraph.polar;
}
극좌표 모드에서는 X축이 각도 극좌표축으로 변환되고, Z축은 반경 극좌표축으로 변환됩니다. 표면 점은 새로운 축에 따라 재계산됩니다.
방사형 축 레이블은 기본적으로 그래프 바깥쪽에 그려집니다. 그래프 내부의 0도 각도 축 바로 옆에 레이블을 그리려면, 레이블에 대한 오프셋을 아주 작게 정의하십시오:
radialLabelOffset: 0.012D 효과를 적용하려면, 투영 모드에 따라 ` rotationEnabled ` 속성을 자동으로 전환하는 사용자 정의 입력 핸들러로 기본 입력 핸들러를 재정의하여 정투영 모드에서 그래프 회전을 비활성화하십시오:
inputHandler: TouchInputHandler3D {
    rotationEnabled: !surfaceGraph.orthoProjection
}
오실로스코프
' Oscilloscope ' 탭에서 C++과 QML을 하나의 애플리케이션에 결합하고, 동적으로 변화하는 데이터를 표시해 보세요.
C++의 데이터 소스
항목 모델 기반 프록시는 단순하거나 정적인 그래프에는 적합하지만, 실시간으로 변경되는 데이터를 표시할 때는 최상의 성능을 얻기 위해 기본 프록시를 사용하십시오. 이러한 프록시는 QML에서 지원되지 않습니다. 저장된 데이터 항목이 ` QObject `를 상속받지 않으므로 QML 코드에서 직접 조작할 수 없기 때문입니다. 이러한 한계를 극복하려면, C++에서 간단한 ` DataSource ` 클래스를 구현하여 시리즈의 데이터 프록시를 채우십시오.
QML에서 호출할 수 있는 두 가지 메서드를 제공하는 ` DataSource ` 클래스를 생성하십시오.
class DataSource : public QObject
{
    Q_OBJECT
    ...
Q_INVOKABLE void generateData(int cacheCount, int rowCount, int columnCount,
                              float xMin, float xMax,
                              float yMin, float yMax,
                              float zMin, float zMax);

Q_INVOKABLE void update(QSurface3DSeries *series);
첫 번째 메서드인 ` generateData()`는 표시할 시뮬레이션된 오실로스코프 데이터의 캐시를 생성합니다. 데이터는 QSurfaceDataProxy가 허용하는 형식으로 캐시됩니다:
// Populate caches
auto *generator = QRandomGenerator::global();
for (int i = 0; i < cacheCount; ++i) {
    QSurfaceDataArray &cache = m_data[i];
    float cacheXAdjustment = cacheStep * i;
    float cacheIndexAdjustment = cacheIndexStep * i;
    for (int j = 0; j < rowCount; ++j) {
        QSurfaceDataRow &row = *(cache[j]);
        float rowMod = (float(j)) / float(rowCount);
        float yRangeMod = yRange * rowMod;
        float zRangeMod = zRange * rowMod;
        float z = zRangeMod + zMin;
        qreal rowColWaveAngleMul = M_PI * M_PI * rowMod;
        float rowColWaveMul = yRangeMod * 0.2f;
        for (int k = 0; k < columnCount; k++) {
            float colMod = (float(k)) / float(columnCount);
            float xRangeMod = xRange * colMod;
            float x = xRangeMod + xMin + cacheXAdjustment;
            float colWave = float(qSin((2.0 * M_PI * colMod) - (1.0 / 2.0 * M_PI)) + 1.0);
            float y = (colWave * ((float(qSin(rowColWaveAngleMul * colMod) + 1.0))))
                    * rowColWaveMul
                    + generator->bounded(0.15f) * yRangeMod;

            int index = k + cacheIndexAdjustment;
            if (index >= columnCount) {
                // Wrap over
                index -= columnCount;
                x -= xRange;
            }
            row[index] = QVector3D(x, y, z);
        }
    }
}
두 번째 메서드인 ` update()`는 캐시된 데이터 한 세트를 다른 배열로 복사하며, 이 배열은 ` QSurfaceDataProxy::resetArray()`를 호출하여 시리즈의 데이터 프록시로 설정됩니다. 오버헤드를 최소화하기 위해 배열의 차원이 변경되지 않았다면 동일한 배열을 재사용합니다:
// Each iteration uses data from a different cached array
if (++m_index >= m_data.size())
    m_index = 0;

const QSurfaceDataArray &array = m_data.at(m_index);
int newRowCount = array.size();
int newColumnCount = array.at(0)->size();

// If the first time or the dimensions of the cache array have changed,
// reconstruct the reset array
if (!m_resetArray || series->dataProxy()->rowCount() != newRowCount
        || series->dataProxy()->columnCount() != newColumnCount) {
    m_resetArray = new QSurfaceDataArray();
    m_resetArray->reserve(newRowCount);
    for (int i = 0; i < newRowCount; ++i)
        m_resetArray->append(new QSurfaceDataRow(newColumnCount));
}

// Copy items from our cache to the reset array
for (int i = 0; i < newRowCount; ++i) {
    const QSurfaceDataRow &sourceRow = *(array.at(i));
    QSurfaceDataRow &row = *(*m_resetArray)[i];
    std::copy(sourceRow.cbegin(), sourceRow.cend(), row.begin());
}

// Notify the proxy that data has changed
series->dataProxy()->resetArray(m_resetArray);
이전에 프록시로 설정된 배열 포인터를 조작하고 있더라도, 그 안의 데이터를 변경한 후에는 그래프가 데이터를 렌더링하도록 유도하기 위해 QSurfaceDataProxy::resetArray()을 호출해야 합니다.
QML에서 DataSource 메서드에 접근할 수 있도록 하려면, DataSource를 QML_ELEMENT 로 만들어 데이터 소스를 노출해야 합니다:
class DataSource : public QObject
{
    Q_OBJECT
    QML_ELEMENT
또한, CMakeLists.txt에서 이를 QML 모듈로 선언하십시오:
qt6_add_qml_module(qmlsurfacegallery
    URI SurfaceGallery
    VERSION 1.0
    NO_RESOURCE_TARGET_PATH
    SOURCES
        datasource.cpp datasource.h
    ...
)
모든 환경과 빌드에서 DataSource 클래스 메서드의 매개변수로 QSurface3DSeries 포인터를 사용하려면 메타 타입이 등록되어 있는지 확인하십시오:
qRegisterMetaType<QSurface3DSeries *>();QML 애플리케이션
DataSource 를 사용하려면 QML 모듈을 임포트하고 사용할 DataSource 인스턴스를 생성하십시오:
import SurfaceGallery
...
DataSource {
    id: dataSource
}
Surface3D 그래프를 정의하고 Surface3DSeries를 할당합니다:
Surface3D {
    id: surfaceGraph
    anchors.fill: parent

    Surface3DSeries {
        id: surfaceSeries
        drawMode: Surface3DSeries.DrawSurfaceAndWireframe
        itemLabelFormat: "@xLabel, @zLabel: @yLabel"
그래프에 연결하는 Surface3DSeries에 프록시를 지정하지 마십시오. 이렇게 하면 해당 시리즈가 기본 QSurfaceDataProxy를 사용하게 됩니다.
itemLabelVisible 를 사용하여 항목 레이블을 숨기십시오. 동적이며 빠르게 변화하는 데이터의 경우, 떠다니는 선택 레이블은 주의를 분산시키고 가독성을 떨어뜨릴 수 있습니다.
itemLabelVisible: false선택 포인터 위에 표시되는 기본 플로팅 레이블 대신, Text 요소에 선택된 항목 정보를 표시할 수 있습니다:
onItemLabelChanged: {
    if (surfaceSeries.selectedPoint == surfaceSeries.invalidSelectionPosition)
        selectionText.text = "No selection";
    else
        selectionText.text = surfaceSeries.itemLabel;
}
그래프가 완성되면 generateData() 헬퍼 함수를 호출하여 DataSource 캐시를 초기화하십시오. 이 함수는 DataSource 에 있는 동명의 메서드를 호출합니다:
Component.onCompleted: oscilloscopeView.generateData();
...
function generateData() {
    dataSource.generateData(oscilloscopeView.sampleCache, oscilloscopeView.sampleRows,
                            oscilloscopeView.sampleColumns,
                            surfaceGraph.axisX.min, surfaceGraph.axisX.max,
                            surfaceGraph.axisY.min, surfaceGraph.axisY.max,
                            surfaceGraph.axisZ.min, surfaceGraph.axisZ.max);
}
데이터 업데이트를 트리거하려면, 요청된 간격마다 DataSource 의 update() 메서드를 호출하는 Timer 를 정의하십시오:
Timer {
    id: refreshTimer
    interval: 1000 / frequencySlider.value
    running: true
    repeat: true
    onTriggered: dataSource.update(surfaceSeries);
}
직접 렌더링 활성화
이 애플리케이션은 빠르게 변화하는 대량의 데이터를 처리할 가능성이 있으므로, 성능을 위해 직접 렌더링 모드를 사용합니다. 이 모드에서 앤티앨리어싱을 활성화하려면 애플리케이션 창의 표면 형식을 변경하십시오. QQuickView 에서 사용하는 기본 형식은 앤티앨리어싱을 지원하지 않습니다. main.cpp 에서 제공되는 유틸리티 함수를 사용하여 표면 형식을 변경하십시오:
#include <QtDataVisualization/qutils.h>
...
// Enable antialiasing in direct rendering mode
viewer.setFormat(qDefaultSurfaceFormat(true));
예제 내용
© 2026 The Qt Company Ltd. Documentation contributions included herein are the copyrights of their respective owners. The documentation provided herein is licensed under the terms of the GNU Free Documentation License version 1.3 as published by the Free Software Foundation. Qt and respective logos are trademarks of The Qt Company Ltd. in Finland and/or other countries worldwide. All other trademarks are property of their respective owners.
